Top 10 MOST POWERFUL Candlestick Patterns
Remember, while these patterns can be powerful indicators, they should never be used in isolation. Always consider the overall trend, market conditions, and other technical indicators before making a trading decision.
1. Doji
A Doji is a candlestick pattern that occurs when the opening and closing price of an asset are virtually the same, resulting in a very small body. The pattern signifies indecision in the market, indicating that neither the buyers nor the sellers could gain a decisive advantage.
Why it's powerful: The Doji often signals a potential reversal or a significant pullback in the current trend, especially if found after a prolonged trend.
How it works: After a strong uptrend, the emergence of a Doji can suggest that the buying pressure is subsiding. Conversely, after a downtrend, a Doji may suggest a reduction in selling pressure.
2. Hammer and Hanging Man
Both patterns consist of a single candlestick with a small body and a long lower wick, resembling a hammer.
- Hammer: Appears during a downtrend and can signal a potential bullish reversal.
- Hanging Man: Occurs during an uptrend and can suggest a potential bearish reversal.
Why they're powerful: These patterns illustrate a significant fight between the bulls and bears, with one side ultimately gaining the upper hand by the close of the session.
How they work: The long lower wick shows that sellers pushed the price down significantly, but buyers managed to push it back up, hinting at a shift in momentum.
3. Shooting Star and Inverted Hammer
These patterns are the opposites of the Hammer and Hanging Man but have similar implications.
- Shooting Star: Found after an uptrend and signals a potential bearish reversal.
- Inverted Hammer: Appears after a downtrend, suggesting a potential bullish reversal.
Why they're powerful: They signify a strong rejection of higher or lower prices, indicating potential trend reversals.
How they work: The long upper wick on the Shooting Star shows that buyers pushed the price higher, but sellers took control and pushed it back down. Conversely, the Inverted Hammer's long upper wick indicates a rejection of lower prices.
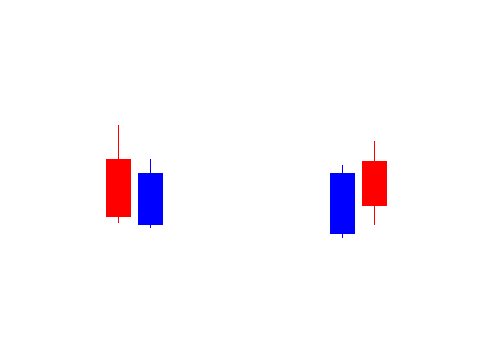
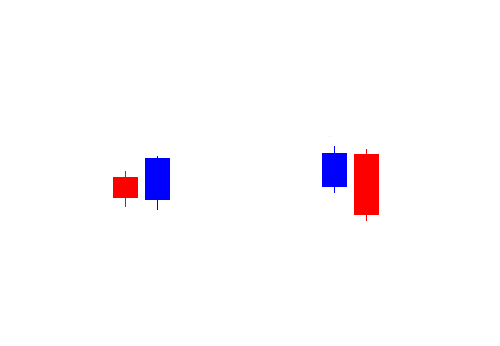
4. Bullish and Bearish Engulfing
This two-candle pattern showcases a full "engulfment" of the previous candle's body.
- Bullish Engulfing: Occurs after a downtrend and suggests a strong move upwards might follow.
- Bearish Engulfing: Appears after an uptrend and signals a potential downward movement.
Why they're powerful: They indicate a complete change in market sentiment over a short period.
How they work: The second candle in the pattern fully engulfs the previous candle, showing a strong shift in the balance between buyers and sellers.
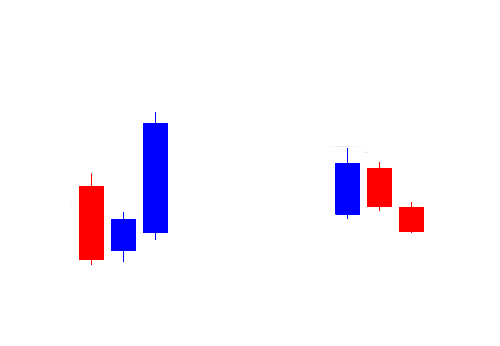
5. Morning Star and Evening Star
These three-candle patterns signal potential reversals in the market.
- Morning Star: Indicates the end of a downtrend and the start of a bullish phase.
- Evening Star: Heralds the end of an uptrend and the beginning of a bearish phase.
Why they're powerful: They highlight a clear shift in momentum over three trading sessions.
How they work: The middle candle, which is smaller than the other two, represents indecision, but the third candle confirms the new direction of the trend.
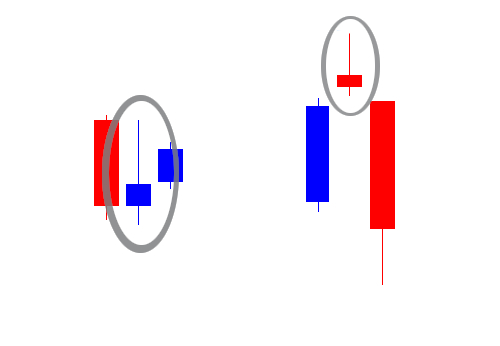
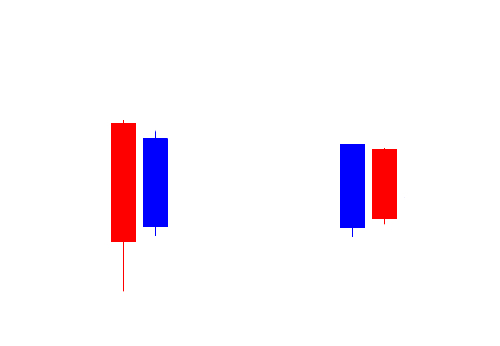
6. Tweezer Tops and Tweezer Bottoms
These are two-candle patterns where the high (for tops) or low (for bottoms) are roughly the same, resembling a pair of tweezers.
Why they're powerful: They signify a strong rejection of a certain price level, often acting as support or resistance.
How they work: After a trend, the market tests a level twice but fails to break through, suggesting a potential reversal.
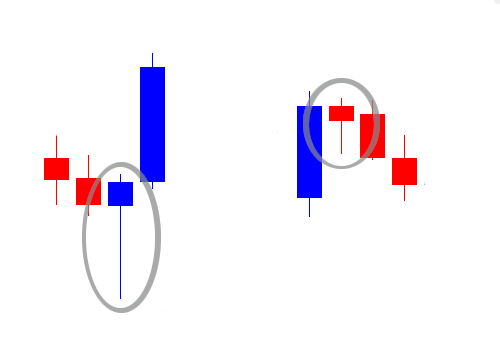
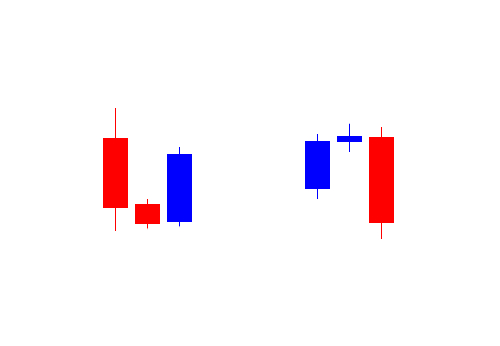
7. Bullish and Bearish Harami
This two-candle pattern consists of a large candle followed by a smaller candle that is completely contained within the range of the first candle.
Why they're powerful: They indicate a potential reversal or a weakening trend.
How they work: After a strong movement, the smaller candle signifies reduced momentum and potential consolidation or reversal.
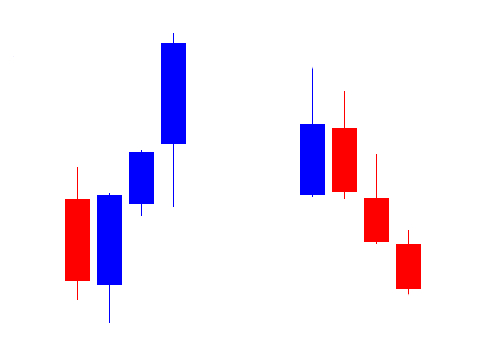
8. Three White Soldiers and Three Black Crows
These are three-candle patterns.
- Three White Soldiers: Signify a strong bullish reversal or continuation after a downtrend.
- Three Black Crows: Indicate a strong bearish reversal or continuation after an uptrend.
Why they're powerful: They represent a sustained buying or selling effort over three sessions.
How they work: Each of the three candles in the pattern should be relatively large and close near their highs (for Three White Soldiers) or lows (for Three Black Crows).
9. Three Inside Up and Three Inside Down
These are another set of three-candle patterns.
- Three Inside Up: Indicates a bullish reversal after a downtrend.
- Three Inside Down: Suggests a bearish reversal after an uptrend.
Why they're powerful: They confirm a harami pattern with a third candle, adding more weight to the reversal signal.
How they work: The third candle closes higher (for Three Inside Up) or lower (for Three Inside Down) than the first candle, confirming the reversal.
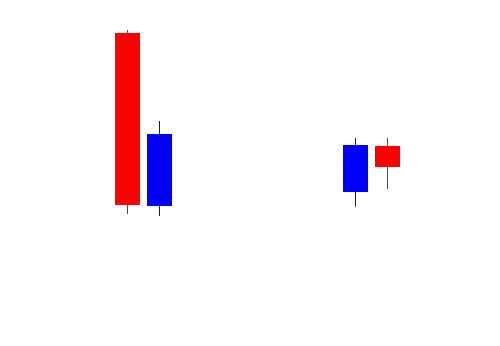
10. Piercing Line and Dark Cloud Cover
These two-candle patterns are quite similar to the Bullish and Bearish Engulfing patterns but with a key difference.
- Piercing Line: Occurs after a downtrend and signals a bullish reversal. The second candle opens below the previous low but closes above the midpoint of the first candle.
- Dark Cloud Cover: Appears after an uptrend, indicating a bearish reversal. The second candle opens above the previous high but closes below the midpoint of the first candle.
Why they're powerful: They show a significant shift in sentiment within a single trading session.
How they work: Even though the second candle does not engulf the first one, the significant recovery or decline during the session highlights a change in momentum.