Average True Range (ATR) Strategy Explained
The Average True Range (ATR) Strategy is a valuable technique in technical analysis that helps traders identify potential market volatility, set appropriate stop-loss levels, and pinpoint potential breakout points. This strategy utilizes the ATR indicator to provide insights into potential price movements and risk management.
Understanding the Average True Range Indicator
The Average True Range (ATR) indicator measures market volatility by considering the range between high and low prices over a specified period. A higher ATR value suggests greater price volatility, while a lower value indicates lower volatility. The indicator is often plotted as a line on a price chart.
How the Strategy Works
The ATR Strategy involves two main applications: determining potential stop-loss levels and identifying potential breakout points. Traders can use the ATR indicator to set stop-loss levels beyond the recent price range, accounting for potential market fluctuations. Additionally, ATR can indicate periods of increased volatility, helping traders identify potential breakouts or breakdowns.
Examples
Let's explore examples of the Average True Range Strategy:
Setting Stop-Loss Levels:
Traders can use the ATR value to determine appropriate stop-loss levels. For instance, if the ATR value for a currency pair is 50 pips, a trader might consider setting their stop-loss beyond this range to account for potential price fluctuations.
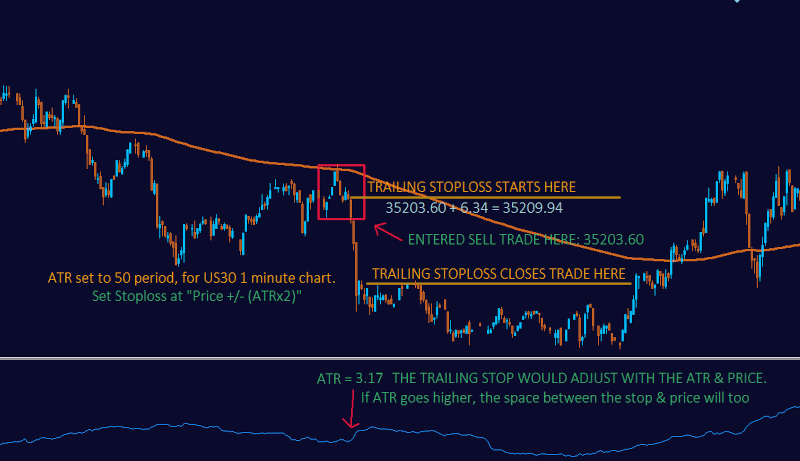
In the following example the ATR is set to 50 and is on the 1 minute timeframe.
This means that the indicator will use the last 50 candles to calculate the average price "flucuation" OR "range". We will multiply the ATR range by 2 and will use that amount as our stoploss distance. This distance will change with each reading and is easiest to use an expert advisor to do the trailing.
Identifying Breakout Points:
If the ATR value suddenly increases, it might suggest that the market is experiencing higher volatility. Traders could interpret this as a potential breakout or breakdown point, indicating a significant price movement ahead.
Combining with Other Indicators
Traders often combine the ATR Strategy with other technical indicators, such as trendlines or moving averages. By incorporating multiple signals, traders can obtain a more comprehensive view of potential market movements.
Average True Range (ATR) Indicator Based Trading Strategies
1. ATR Breakout Strategy:
- Measure the current ATR value to determine market volatility.
- Set a stop-loss distance based on a multiple of the ATR (e.g., 2x ATR) away from the entry price.
- Enter a trade in the direction of a breakout when the price moves beyond the ATR-adjusted stop-loss level.
2. ATR Trend Confirmation Strategy:
- Use ATR to confirm the strength of a trend.
- In an uptrend, the ATR generally rises as volatility increases, signaling potential continuation.
- In a downtrend, the ATR generally rises as well, confirming potential continuation.
3. ATR Trailing Stop Strategy:
- Calculate the ATR value and use it as a dynamic trailing stop.
- Set the stop-loss level a certain number of ATRs away from the current price.
- As the price moves in favor of the trade, adjust the stop-loss level to lock in profits while accounting for volatility.
4. ATR and Moving Average Strategy:
- Combine ATR with moving averages for trend confirmation.
- When the ATR is rising and the price is above a moving average, it may indicate a strong uptrend.
- When the ATR is rising and the price is below a moving average, it may suggest a strong downtrend.
5. ATR Volatility Breakout Strategy:
- Calculate a fixed percentage of the ATR (e.g., 1%) and add it to the highest high or subtract it from the lowest low of a specific period.
- Enter a trade in the direction of the breakout when the price moves beyond the calculated level.
6. ATR Reversal Strategy:
- Use ATR to identify potential exhaustion in a trend.
- If the ATR reaches an extreme level compared to recent values, it might signal a potential trend reversal.
7. ATR and Support/Resistance Strategy:
- Use ATR to gauge potential support and resistance levels.
- When the price approaches a significant level and the ATR is relatively high, it may suggest stronger momentum and potential breakout.
8. ATR Volatility Expansion Strategy:
- Compare the current ATR value to its historical average.
- If the current ATR is significantly higher than the historical average, it may indicate a period of increased volatility and potential trading opportunities.
9. ATR Range Analysis Strategy:
- Measure the ATR of a specific period.
- Observe how the price behaves within the range defined by a certain number of ATRs above and below a moving average.
- Consider trading when the price reaches extreme levels outside this ATR-defined range.
10. ATR Break and Retest Strategy:
- Wait for a breakout to occur based on ATR-adjusted levels.
- After the breakout, wait for a retest of the breakout level to confirm its validity before entering a trade.
Conclusion
The Average True Range (ATR) Strategy is a versatile tool for managing risk and identifying potential breakout points in the market. By understanding the ATR indicator and its implications for volatility, traders can make more informed decisions regarding position sizing, stop-loss placement, and market entry or exit points.