
Day Trading Course for Beginners
Day Trading Lesson 2: Basics of Technical Analysis
Introduction to Technical Analysis
Technical analysis is a method of analyzing and forecasting price movements based on historical market data. Day Traders use technical tools like the fibonacci retracement tool to identify trends, potential entry and exit points, and gauge market sentiment.
Understanding Price Charts
Price charts visually represent the price movements of an asset over a specific period. Different types of charts include:
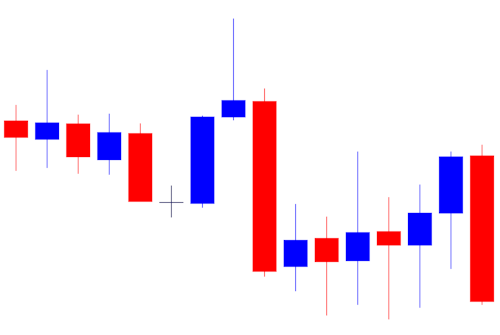
- Candlestick Charts: Display price open, close, high, and low for a specific period using candlestick patterns.
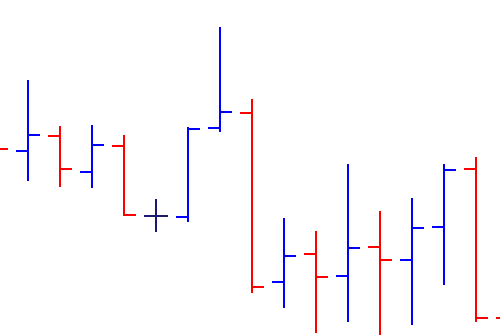
- Bar Charts: Represent price open, close, high, and low using vertical bars.
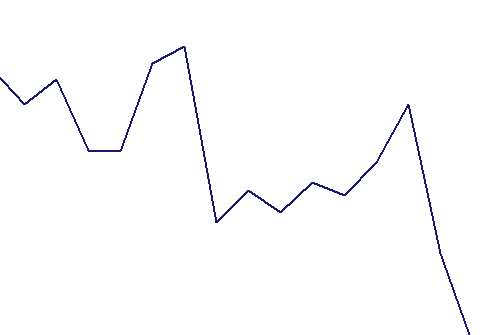
- Line Charts: Connect closing prices with lines to visualize trends over time.
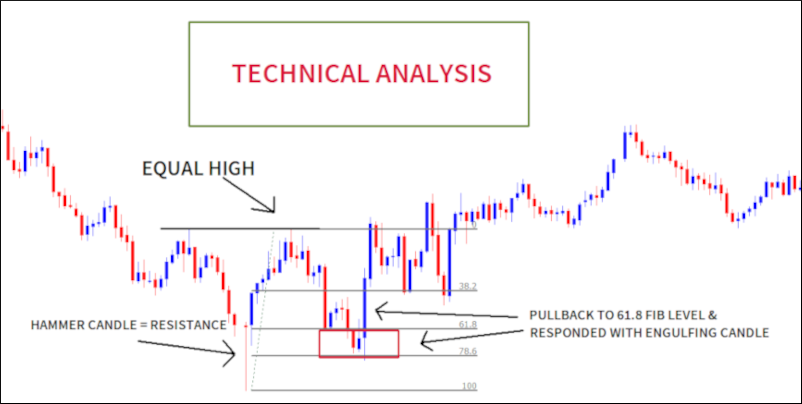
Support and Resistance Levels
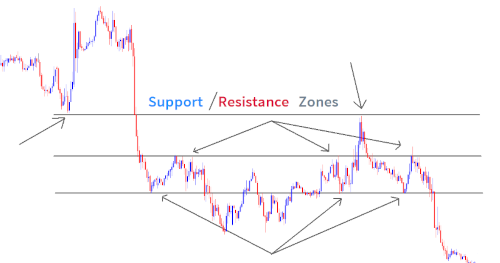
Support and resistance levels are price levels where the market tends to pause, reverse, or exhibit increased buying/selling activity. Traders use these levels to make decisions on potential entry and exit points.
In the above example you can see that the very first support level was broken and later on in the image, that same support zone became a resistance zone.
A popular way to think of support and resistance is to think of them as a floor and a ceiling of a very tall skyscraper. When price runs into a ceiling it gets rejected but does make a dent in it. After enough repeated attempts, the price will "breakout" of the ceiling and that ceiling will now become a floor for price.
The more times a floor or ceiling is hit, the weaker it generally becomes.
Tip:
Wait for price to actually fully close above or below a support or resistance zone to confirm the breakout. Price often moves above or below and is immediatly pushed in the opposite direction before closing, leaving a wicked candle.
Sometimes over zealous traders enter before the candle closes, only to have price reverse on them.
Trend Identification and Indicators
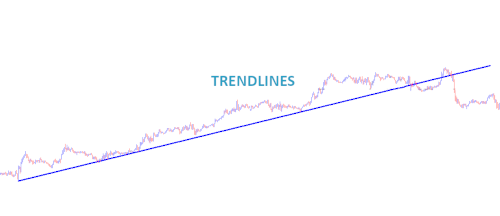
Trends represent the general direction in which prices are moving. Traders use trendlines, moving averages, and trend indicators (e.g., Moving Average Convergence Divergence - MACD) to identify and confirm trends.
At the core of determining a trend though is answering the question: Is price making a series of new higher highs or new lower lows? New higher highs means the market is uptrending and new lower lows means the market is downtrending.
There is much more to learn in this area though, as this occurs on all scales. What this means is that although a small timeframe like a 1 minute chart, could be making lower lows, the 15 minute timeframe may be making higher highs.
If this seems confusing, don't worry.. it will be covered later.
Practical Exercises
Practice analyzing different types of price charts, identifying support and resistance levels, and using basic trend indicators to spot potential trading opportunities. Applying technical analysis concepts will enhance your ability to make informed trading decisions.
Next up: Day Trading Lesson 3: Fundamental Analysis and News Trading