
Day Trading Course for Beginners
Day Trading Lesson 8: Developing Trading Strategies
Systematic vs. Discretionary Trading
Day traders can adopt two main approaches: systematic and discretionary trading. Systematic trading involves executing trades based on predefined rules and algorithms. Discretionary trading, on the other hand, relies on a trader's judgment and interpretation of market conditions.
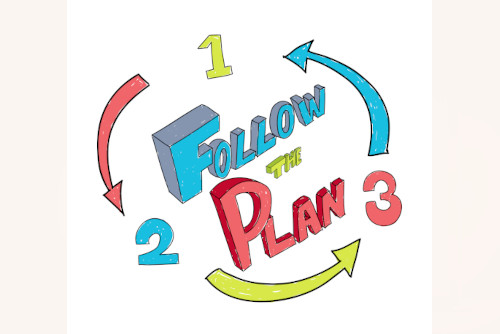
Building a Trading Plan
A trading plan is a detailed outline of your trading approach, including strategy, risk management, and execution. It helps traders stay disciplined and consistent. A trading plan includes entry and exit criteria, position sizing, risk-reward ratios, and guidelines for trade management.
Backtesting and Optimizing Strategies
Before implementing a trading strategy, it's crucial to backtest it using historical data. Backtesting involves applying the strategy's rules to past price movements to assess its performance. Optimization fine-tunes the strategy's parameters for better results, but caution is needed to avoid overfitting.
Combining Multiple Indicators for Robust Strategies
Many traders create strategies by combining multiple indicators. This can provide more robust signals, as confirmation from various indicators reduces the likelihood of false signals. Common combinations include using a trend-following indicator along with an oscillator for entry confirmation.
Example Trading Strategy
For this example, we have combined 2 tools and 3 indicators. The fibonacci retracement tool, fibonacci expansion tool, the 55 and 233 period moving averages and the Awesome Oscillator.
We are not saying this strategy is the strategy we recommend, but is an example to get you used to combining market structure with multiple indicators and tools to create a strategy.
Our entry strategy will be based on the following RULES:
- Trade Time:
If trading on timeframes smaller than the 15 minute(5 Min/1 Min), trade time must not be during the New York open or major news times. The volatility at these times makes any strategy much harder to work. 15 minutes after either, is good enough time to resume trading.
- Higher Highs OR Lower Lows:
Price must have recently made a new swing high that exceeded the previous swing high(Higher high) OR a swing low that exceeded the previous swing low(Lower low), to signal a direction.
- Moving Averages in Order:
The 55 period Moving Average must be above the 233, for a buy and below for a sell.
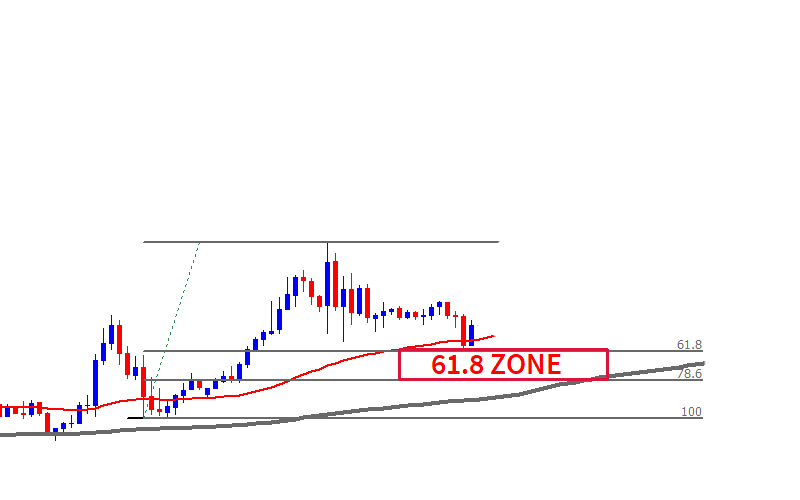
- Fibonacci Retracement
Price must come back down to the key fibonacci levels (61.8, 78.6). We avoid the 38.2 because it often results in fake outs.
- Moving Average Bounce:
The price must also be bouncing off(Or very close to) one of the 2 moving averages. NO TANGLED MOVING AVERAGES (RANGING MARKET)
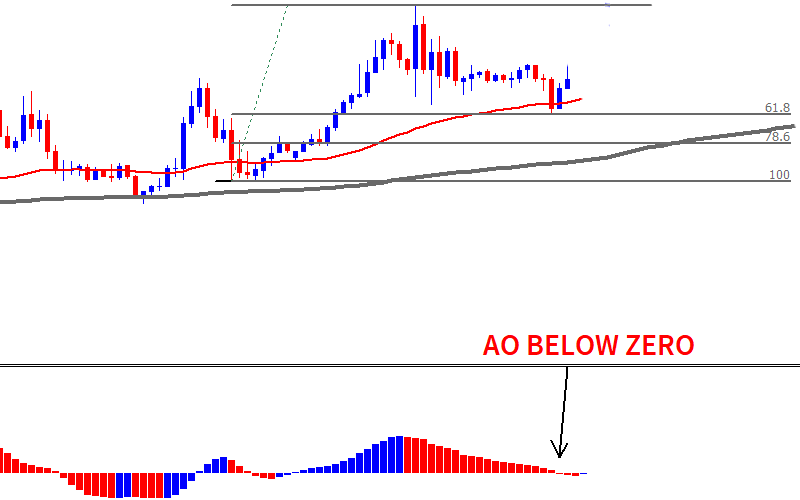
- Awesome Oscillator:
During the retracement process, the Awesome Oscillator must have gone below zero for a buy or above zero for a sell. (The awesome oscillator is very similar in readings as the MACD)
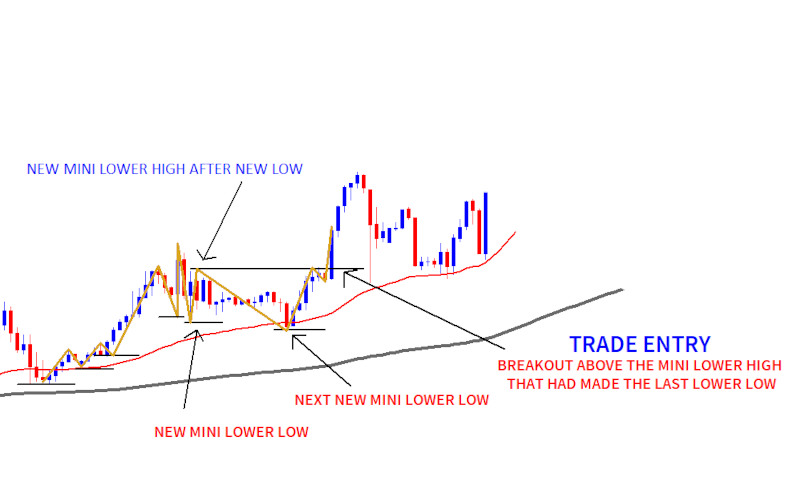
- Mini Structure Break:
During the retracement process, as learned in the last lesson, a series of mini swing highs or lows will happen in the direction opposite of the main trend.
After hitting our fib zone, we wait for this break to happen and then enter our trade.
- Stoploss:
The Stoploss goes just a little above(For a Sell and below for a buy) the spot that was rejected at the 61.8-78.6
- Takeprofit:
Using the Fibonacci Extension tool, we set our take profits just before the 100.0 Fib Extension Level.
- Alternate Closing:
Using a buy trade as an example; If the Awesome Oscillator goes above zero, but then returns below zero before TakeProfits are triggered, we close our trade.
Our Strategy in Action
NEW SWING HIGH OR LOW?

YES.
Moving Averages in order? 55 above 233? YES
DID PRICE RETRACE TO THE 61.8 OR 78.6?
YES.
IS PRICE BOUNCING OFF A MOVING AVERAGE?
YES.
DID THE AWESOME OSCILLATOR GO BELOW ZERO?
YES.
DID THE RETRACEMENT STRUCTURE OF MINI LOWER LOWS(In this case) GET BROKEN?(Feel free to drop timeframes for a clearer picture)
YES.
SET TAKE PROFIT AT THE 100.0 FIB EXTENSION ZONE...
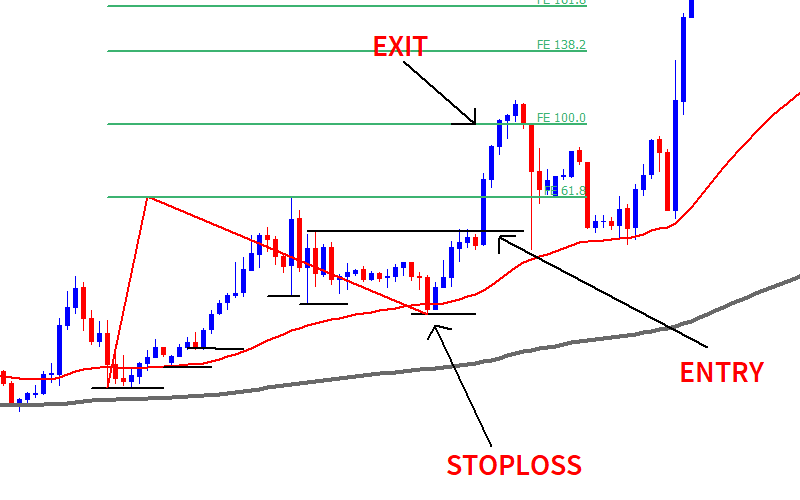
DID IT HIT TAKE PROFIT? YES.
This trade is on the hourly chart so this trade made a great return for a nice 42 pips.
Let's quickly take a look at another one. This time its a downtrend.
Remember your checklist...
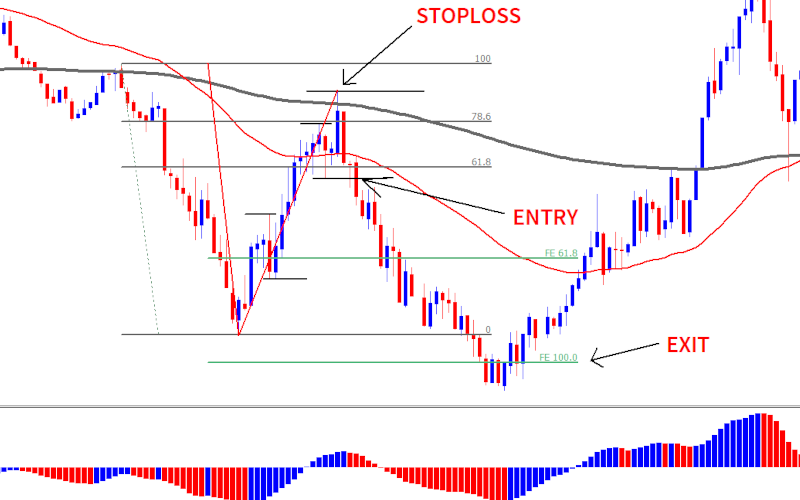
TRADE TIMES OK? YES.
LOWER LOWS? YES.
MOVING AVERAGE 55 BELOW MOVING AVERAGE 233? YES
DID PRICE RETRACE TO 61.8-78.6? YES.(And a tiny bit farther)
DID PRICE RUN INTO A MOVING AVERAGE? YES.
AWESOME OSCILLATOR GO ABOVE ZERO? YES.
DID THE RETRACEMENT STRUCTURE BREAK? YES.
DID IT HIT TAKE PROFIT AT THE 100.0 FIB EXTENSION LEVEL? YES.
You may have noticed that this trade went quite far back, even beyond the 78.6. You may have also noticed that the fib extension tool adjusted with it, for a closer take profit than our previous example. A strong pullback like that suggests a lot of buyers in this area
If you look to the right of the exit, the price went up, all the way beyond the previous swing high, beginning a new uptrend.
Practical Exercises
Practice creating a systematic or discretionary forex trading plan. Backtest and optimize your chosen strategy using historical data. Experiment with combining indicators to develop more reliable trading signals.
Next up: Day Trading Lesson 9: Trading Psychology and Discipline