Bollinger Bands Strategy Explained
The Bollinger Bands Strategy is a powerful technical analysis approach that helps traders identify potential price volatility, reversals, and breakout points. This strategy, applicable across various chart timeframes, offers insights into potential buy and sell signals based on the interaction between price and the Bollinger Bands.
Understanding Bollinger Bands
Bollinger Bands consist of three lines: the middle line, which is usually a Simple Moving Average (SMA), and two outer bands that are calculated as a certain number of standard deviations away from the middle line. The standard settings use a 20-period SMA and two standard deviations.
Although these settings are the standard, you are not bound by them. Feel free to experiment.
You may find tightening or loosening them up could work better for a more or less volatile chart than normal, or even may find certain settings are better or worse on certain timefreames.
How the Strategy Works
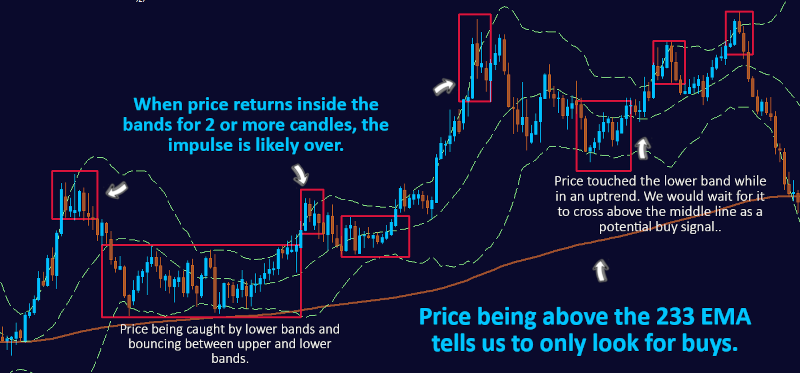
The Bollinger Bands Strategy involves analyzing price movements in relation to the Bollinger Bands. When the price touches the lower band and starts to rise, it can signal a potential price reversal and generate a buy signal. Conversely, when the price touches the upper band and starts to decline, it can indicate a potential price reversal and generate a sell signal.
Examples on Different Timeframes
Let's explore how the Bollinger Bands Strategy can be applied across various chart timeframes:
1-Minute Chart:
On a 1-minute chart, the Bollinger Bands Strategy can provide rapid signals for short-term traders. For instance, if the price touches the lower Bollinger Band and starts rising, traders might interpret it as a buy signal, suggesting a potential short-term price bounce. Conversely, if the price touches the upper Bollinger Band and starts declining, it might be seen as a sell signal, indicating potential short-term downward movement.
1-hour chart
On a 1-hour chart, the Bollinger Bands Strategy can be used in the same way, but it is a great idea to move down in timeframes to something like the 1-minute chart, to get a ,more precise entry, with the least amount of draw down.
The higher the chart timeframe, the longer the moves will last. Many traders prefer quicker trades, so they use the higher timeframes to show the overal direction, and then trade with that direction on the smaller timeframes.
Combining with Other Indicators
Traders often combine the Bollinger Bands Strategy with other indicators, such as the Relative Strength Index (RSI) or support/resistance levels. By incorporating multiple signals, traders can gain a more comprehensive view of potential market movements and refine their trading strategy.
Bollinger Bands Based Trading Strategies
1. Bollinger Squeeze Breakout Strategy:
- Identify periods of low volatility where the Bollinger Bands narrow (squeeze).
- Wait for a breakout when the price closes above the upper band or below the lower band.
- This breakout can signal the start of a new trend or a significant price movement.
2. Bollinger Bands Trend Following Strategy:
- Use Bollinger Bands to determine the direction of the trend.
- In an uptrend, the price generally stays above the middle band (20-day moving average) and may touch the upper band.
- In a downtrend, the price typically remains below the middle band and may touch the lower band.
- Look for opportunities to enter trades in the direction of the trend when the price retraces to the middle band.
3. Bollinger Bands Reversal Strategy:
- Identify overextended price moves by observing the price touching or exceeding the outer bands.
- Wait for a reversal signal, such as a bearish candlestick pattern or divergence on an oscillator, when the price touches the upper band (potential overbought condition) or the lower band (potential oversold condition).
4. Bollinger Bands and RSI Strategy:
- Combine Bollinger Bands with the Relative Strength Index (RSI) indicator.
- Look for price touches or penetrations of the outer bands along with RSI readings indicating potential overbought or oversold conditions.
- Wait for confirmation from the RSI before considering trades in the opposite direction of the trend.
5. Bollinger Bands and Moving Average Crossover Strategy:
- Use a combination of Bollinger Bands and moving averages.
- Wait for the shorter-term moving average (e.g., 20-day MA) to cross above or below the middle band of the Bollinger Bands.
- This crossover can signal potential trend changes and provide entry or exit points.
6. Bollinger Bands and MACD Strategy:
- Combine Bollinger Bands with the Moving Average Convergence Divergence (MACD) indicator.
- Look for crossovers and divergence patterns on the MACD while considering the Bollinger Bands' positioning.
- These signals can provide insights into potential trend reversals or continuation.
7. Bollinger Bands and Support/Resistance Strategy:
- Use Bollinger Bands to identify potential support and resistance levels.
- When the price approaches the upper or lower band, pay attention to previous price action at those levels.
- Look for bounces or breakouts from these levels in conjunction with other confirming signals.
Conclusion
The Bollinger Bands Strategy is a versatile tool for identifying potential price reversals, volatility, and breakout points. Its adaptability to different timeframes makes it suitable for various trading styles. By understanding how price interacts with the Bollinger Bands and considering additional indicators, traders can enhance their decision-making process and increase their trading success.