How to Trade .618, Using the Fibonacci Retracement Tool
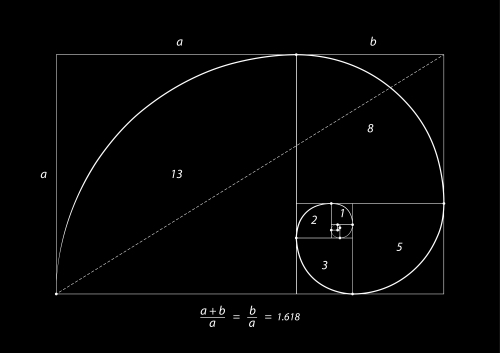 The Fibonacci retracement tool is a popular technical analysis instrument that draws potential support and resistance levels based on key Fibonacci ratios. Among the Fibonacci levels, the 0.618 (often referred to as the "Golden Ratio") holds significant importance.
You can find your fibonacci retracement tool by vnavigating to the topbar of your MT4 terminal and clicking "Insert"-> "Fibonacci"->"Retracement" OR clicking the icon with an "F" on it.
After drawing out your tool, you can alter the settings.
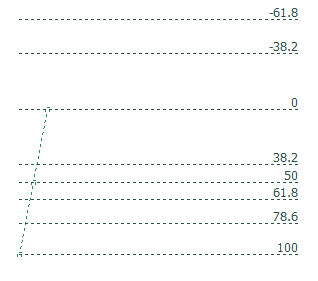 Our Fibonacci Retracement tool is set up different than the default mt4 setup. The default settings make the extension levels go in the opposite direction than what would make sense. We find it easier to draw from "Low to high" in an uptrend and have the extensions continue upward.
The only difference from the default levels in in how you input you extension levels. Using negative digits produces the proper result.
Here is how to set it up as we do, if you choose:
Level: O
Description: 0.0
Level: 1
Description: 100
Level: O.618
Description: 61.8
Level: O.786
Description: 78.6
Level: O.382
Description: 38.2
Level: O.5
Description: 50.0
Level: -0.382
Description: -38.2 OR 138.2
Level: -0.618
Description: -61.8 OR 161.8
Steps to Trade Using the 0.618 Fibonacci Level:
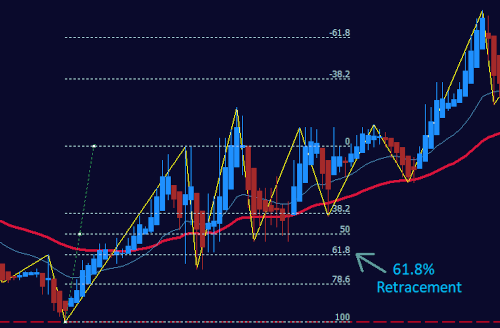 The example image below shows the classic, 20 period and 50 period moving averages (Using Heikenashi Candles instead of traditional). When at the end of a downtrend, the price will begin making new highs instead of new lows.
At the same time, the 20 period EMA (EXPONENTIAL MOVING AVERAGE), will cross above the 50 period moving average.
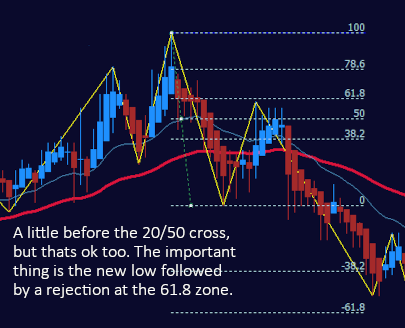
This signals a possible trend reversal. After this happens, you draw a fibonacci extension from the low to the new high and wait for the retracement to the 61.8 level. (If it was an explosive trend reversal you will sometimes only get a 38.2 retracement)
Steps
- Identify the Trend: Recognize the prevailing market trend, as Fibonacci levels are most effective in trending markets.
- Draw the Fibonacci Retracement Levels:
- For an uptrend: From the swing low to the swing high.
- For a downtrend: From the swing high to the swing low.
- Wait for Price Action Confirmation: Upon the price reaching the 0.618 level, seek confirmation through bullish or bearish candlestick patterns before entering the trade.
- Combine with Other Indicators: Use complementary technical indicators like RSI or Moving Averages to reinforce your trading decision.
- Set Stop-Loss and Take-Profit Levels: Determine entry and exit points that align with your risk tolerance and trading strategy.
- Consider Market Context: Be aware of upcoming significant news or economic events that might cause volatility.
- Risk Management: Ensure you're risking only a fraction of your capital on each trade to safeguard your portfolio.
- Review and Learn: Post-trade, analyze the outcome to refine and enhance your trading strategy.
Further Considerations:
The 0.618 Fibonacci retracement level is renowned for its significance in trading. However, relying solely on one technical tool isn't advisable. Consider integrating various indicators and tools to formulate a comprehensive trading approach. Also, always stay updated with market news, as fundamental factors can sometimes overshadow technical setups.
Conclusion:
Fibonacci retracement levels, especially the 0.618, can be powerful tools in a trader's arsenal when used correctly. Yet, the importance of a holistic approach—combining Fibonacci with other tools, understanding market context, and employing robust risk management—cannot be stressed enough for trading success.
For more insights on trading strategies and tools, visit our Trading Strategy Education Section.