Moving Average Convergence Divergence (MACD) Strategy Explained
The Moving Average Convergence Divergence (MACD) Strategy is a widely used technical analysis technique that helps traders identify potential trend changes and momentum shifts. This strategy is particularly powerful across various chart timeframes, offering insights into potential buy and sell signals.
Understanding the MACD Indicator
The MACD indicator consists of two main components: the MACD line and the signal line. It measures the difference between two moving averages: the 12-period and 26-period Exponential Moving Averages (EMAs). The MACD line represents this difference, while the signal line is the 9-period EMA of the MACD line.
How the Strategy Works
The MACD Strategy centers around crossovers between the MACD line and the signal line. When the MACD line crosses above the signal line, it generates a bullish signal, indicating potential upward momentum and a potential trend reversal or continuation. Conversely, when the MACD line crosses below the signal line, a bearish signal emerges, suggesting potential downward momentum.
The MACD line being above zero is very suggestive of an up trend. In the same respect, when the MACD is below zero it indicates a downtrend.
The MACD crossing above OR below zero (after a retracement) can be a great signal in itself, especially if you already have other confirmations, such as moving averages displaying a trend in the same direction.
If the trend is strong, then the zero cross entry can be very efficient, as well.
Examples on Different Timeframes
Let's explore how the MACD Strategy operates across various chart timeframes:
1-Minute Chart:
On a 1-minute chart, the MACD Strategy can provide rapid signals for short-term traders. For instance, if the MACD line crosses above the signal line and both are above the zero line, traders might interpret it as a buy signal, suggesting a potential short-term uptrend. Conversely, if the MACD line crosses below the signal line and both are below the zero line, it might signal a potential short-term downtrend.
Daily Chart
On the daily chart, the MACD Strategy can provide signals that literally last for days or even weeks. This isn't something a lot of traders are interested in. However using the daily as a reference for, whats called "TOP DOWN ANALYSIS" is extremely powerful.
For example, lets consider the EUR/USD on daily chart.
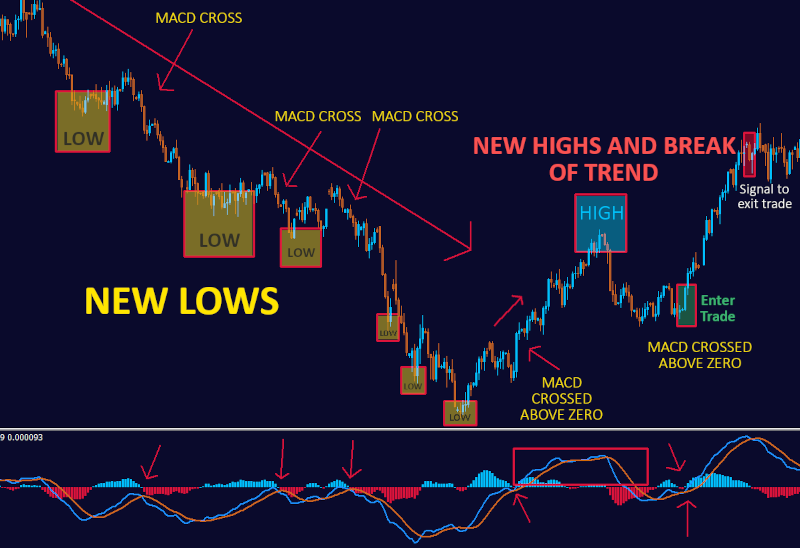
Imagine it has recently made a series of new lows, then a failed new low attempt and then a new high, (Indicating that the downtrend is likely to reverse into into an uptrend or at least a large retracement.
In addition to this, the MACD main line has gone far above zero and has crossed back down toward the zero area.
Finally, it is has just crossed above the signal line again back into an upward swing. Remember this is on the Daily chart.
As soon as we see this we can safely move down time frames, all the way to the one minute if we like, to prepare for the likelihood of an explosive uptrend that can last for days or even weeks.
Our bias can then be heavily weighted with the information gained from the MACD momentum indicated on the Daily chart.
All of the MACD signals on the daily are great spots for trading on the smaller timeframes. If you can eliminate half the guess work by buying or selling in the direction of the momentum, you can increase your probabilities considerably.
Combining with Other Indicators
Traders often enhance the MACD Strategy by incorporating additional indicators, such as trendlines or support/resistance levels. By combining signals from various indicators, traders can obtain a more comprehensive view of potential market movements and make more informed decisions.
MACD Based Trading Strategies
1. MACD Crossover Strategy:
- Identify crossovers between the MACD line and the signal line.
- A bullish crossover occurs when the MACD line crosses above the signal line, indicating potential upward momentum.
- A bearish crossover occurs when the MACD line crosses below the signal line, suggesting potential downward momentum.
2. MACD Histogram Strategy:
- Pay attention to the MACD histogram, which represents the difference between the MACD line and the signal line.
- A rising histogram indicates increasing momentum in the direction of the trend.
- A falling histogram suggests weakening momentum and potential reversal.
3. MACD Divergence Strategy:
- Look for divergence between the price chart and the MACD indicator.
- Bullish divergence occurs when the price makes lower lows while the MACD makes higher lows, suggesting potential upward reversal.
- Bearish divergence occurs when the price makes higher highs while the MACD makes lower highs, indicating potential downward reversal.
4. MACD Trend Following Strategy:
- Use the MACD line as a trend-following tool.
- In an uptrend, the MACD line stays above the zero line, and traders may consider long positions.
- In a downtrend, the MACD line stays below the zero line, and traders may consider short positions.
5. MACD and Signal Line Crossover Strategy:
- Observe crossovers between the MACD line and the signal line to identify potential entry and exit points.
- In addition to the traditional MACD crossover, traders can also consider multiple crossovers to confirm trends.
6. MACD and Moving Average Crossover Strategy:
- Combine the MACD indicator with moving averages.
- Look for crossovers between the MACD line and a longer-term moving average, such as the 200-day MA, for trend confirmation.
7. MACD and Price Patterns Strategy:
- Combine the MACD indicator with classic chart patterns (e.g., head and shoulders, double tops/bottoms).
- Look for MACD crossovers or divergence that align with the formation of chart patterns.
8. MACD and RSI Strategy:
- Combine the MACD indicator with the Relative Strength Index (RSI) for confirmation signals.
- Look for convergence or divergence between the MACD and RSI to validate potential reversals.
9. MACD Trend Reversal Strategy:
- Monitor the MACD histogram for signs of a potential reversal.
- A trend reversal might be signaled when the histogram changes direction from rising to falling (or vice versa).
10. MACD and Support/Resistance Strategy:
- Use the MACD indicator to validate potential support or resistance levels.
- Look for MACD crossovers or divergence near key price levels to confirm potential breakout or reversal.
Conclusion
The Moving Average Convergence Divergence (MACD) Strategy is a versatile tool for identifying potential trend changes and momentum shifts. Its ability to adapt to different chart timeframes makes it suitable for traders with varying trading styles. By understanding the MACD crossovers and considering additional indicators, traders can refine their trading strategy and maximize their chances of success.