Moving Average Crossover Strategy Explained
The Moving Average Crossover strategy is a popular technical analysis approach used by traders to identify potential trend changes and make trading decisions. This strategy is particularly effective when analyzing various chart timeframes, including the 1-minute chart.
Understanding Moving Averages
Moving Averages (MAs) are indicators that smooth out price data over a specified period, allowing traders to observe the underlying trend. The strategy involves using two different moving averages: a shorter-term MA and a longer-term MA.
How the Strategy Works
The strategy's core principle is based on the crossover of these two moving averages. When the shorter-term MA crosses above the longer-term MA, a bullish signal is generated, indicating potential upward momentum and a potential trend reversal or continuation. Conversely, when the shorter-term MA crosses below the longer-term MA, a bearish signal is generated, suggesting potential downward momentum.
Examples on Different Timeframes
Let's explore how the Moving Average Crossover strategy can be applied to different chart timeframes:
1-Minute Chart:
On a 1-minute chart, the Moving Average Crossover strategy can provide rapid signals for short-term traders. For instance, if the 10-period MA crosses above the 20-period MA, traders might consider it a buy signal, suggesting a potential short-term uptrend. Conversely, if the 10-period MA crosses below the 20-period MA, it might be considered a sell signal indicating potential short-term downward movement.
4-Hour Chart:
On a 4-hour chart, the Moving Average Crossover strategy can help identify medium-term trends. Traders might use a 50-period MA and a 200-period MA. If the 50-period MA crosses above the 200-period MA, it could signal a potential medium-term uptrend. Conversely, if the 50-period MA crosses below the 200-period MA, it might suggest a medium-term downtrend.
Daily Chart:
On a daily chart, the Moving Average Crossover strategy can provide signals for longer-term trends. For example, using a 100-period MA and a 200-period MA, if the 100-period MA crosses above the 200-period MA, it might indicate a potential long-term uptrend. If the 100-period MA crosses below the 200-period MA, it could suggest a long-term downtrend.
Combining with Other Indicators
While powerful on its own, traders often combine the Moving Average Crossover strategy with other technical indicators and chart patterns for confirmation. This can help reduce false signals and enhance the strategy's effectiveness.
Moving Average Indicator Based Trading Strategies
1. Moving Average Crossover Strategy:
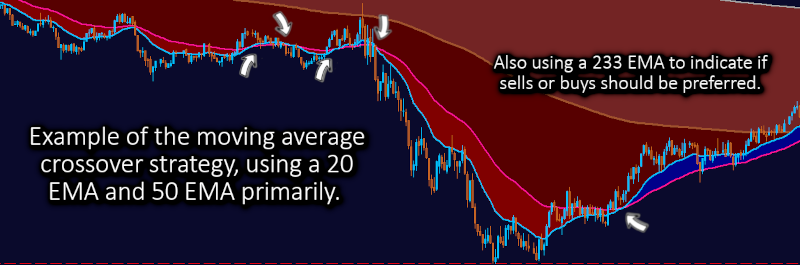
- Identify crossovers between a short-term moving average (e.g., 20-period MA) and a longer-term moving average (e.g., 50-period MA).
- A bullish crossover occurs when the short-term MA crosses above the long-term MA, indicating potential upward momentum.
- A bearish crossover occurs when the short-term MA crosses below the long-term MA, suggesting potential downward momentum.
- It can be very helpful to add in one more slower moving average(e.g., 200-period MA), to confirm the major trend.
- Checkout our Ultimate Moving Average Crossover EA at the bottom of this page or in the EA market, for a ready made expert advisor for this strategy.
2. Moving Average Trend Following Strategy:
- Use a single moving average as a trend-following tool.
- In an uptrend, the price generally stays above the moving average, while in a downtrend, the price stays below it.
- Look for opportunities to enter trades in the direction of the trend when the price retraces to the moving average.
3. Moving Average Support/Resistance Strategy:
- Treat a moving average as a dynamic support or resistance level.
- When the price approaches the moving average from below, it might act as support.
- When the price approaches the moving average from above, it might act as resistance.
4. Moving Average Bounce Strategy:
- Look for price bounces off a moving average.
- When the price touches or comes close to the moving average, consider potential trades in the direction of the bounce.
5. Moving Average Breakout Strategy:
- Monitor moving averages for potential breakout signals.
- A breakout occurs when the price closes above a moving average in an uptrend or below it in a downtrend.
- Consider entering trades in the direction of the breakout.
6. Moving Average Ribbon Strategy:
- Use multiple moving averages of different periods plotted on the chart.
- When these moving averages are stacked close to each other, they form a "ribbon" that visually represents trends.
- Look for alignment and stacking of moving averages for potential trading signals.
7. Moving Average Envelopes Strategy:
- Plot a percentage-based envelope around a moving average.
- When the price moves outside the envelope, it suggests potential overbought or oversold conditions.
- Consider trades in the direction of the price moving back inside the envelope.
8. Moving Average and MACD Strategy:
- Combine a moving average crossover strategy with the Moving Average Convergence Divergence (MACD) indicator.
- Look for crossovers between moving averages and MACD signals to confirm trend changes.
9. Moving Average and RSI Strategy:
- Combine a moving average crossover strategy with the Relative Strength Index (RSI) indicator.
- Look for crossovers between moving averages and RSI signals to confirm potential reversals.
10. Moving Average Break and Retest Strategy:
- Wait for a moving average breakout and price close above it.
- Look for a retest of the moving average from above, where it acts as support.
- Consider entering trades on the retest confirmation.
Conclusion
The Moving Average Crossover strategy is a versatile approach that can be applied to various chart timeframes, making it suitable for traders with different preferences. By understanding the crossovers of moving averages and combining with other tools, traders can make more informed trading decisions.
As with many trading strategies, "The Trend is Your Friend". It is always safer to trade with the trend. Using larger moving averages, like the 233 EMA, can give you a clearer picture of what trades to take. When the 50 period moving average is below the 233, you are safest to look for selling opportunities.
Once you become great at spotting opportunities and getting a feel for the chart you could alter that strategy to "When price is below the 233 I can start looking at sells"(To pick up a few more trades at the very start of trends, but still with more risk involved).
Need any help automating this strategy? We have created an EA to assist you. Recieve notifications to your phone, of moving average crossovers, open and close trades automatically, trailing stops, custom moving average and much more.
Click here to learn more about this EA