Parabolic SAR Strategy Explained
The Parabolic SAR (Stop and Reverse) Strategy is a popular trend-following technical analysis approach that helps traders identify potential trend direction changes and entry/exit points. This strategy utilizes the Parabolic SAR indicator, which provides visual cues on the price chart to indicate potential trend reversals.
Understanding the Parabolic SAR Indicator
The Parabolic SAR indicator consists of dots that appear either above or below the price chart, depending on the current trend direction. When dots are below the price, it suggests an uptrend, and when dots are above the price, it suggests a downtrend. The distance between the dots and the price indicates the strength of the trend.
How the Strategy Works
The Parabolic SAR Strategy focuses on the interaction between the Parabolic SAR dots and the price chart:
- Uptrend: During an uptrend, the Parabolic SAR dots are below the price. As long as the price remains above the dots, it suggests the uptrend is intact. Traders might consider buying or holding long positions.
- Downtrend: During a downtrend, the Parabolic SAR dots are above the price. As long as the price remains below the dots, it indicates the downtrend is ongoing. Traders might consider shorting or holding short positions.
- Reversal: When the price crosses the Parabolic SAR dots, it can signal a potential trend reversal. The dots flip from being above to below the price (or vice versa). Traders might consider reversing their positions or taking profit/loss.
Examples
Let's explore examples of the Parabolic SAR Strategy:
Uptrend Confirmation:
During an uptrend, if the price remains consistently above the Parabolic SAR dots, it validates the upward momentum. Traders might hold long positions until a potential reversal signal occurs.
Reversal Signal:
If the price crosses below the Parabolic SAR dots during an uptrend, it might indicate a potential trend reversal. Traders could consider exiting long positions or even shorting if the downtrend continues.
Let's look at a downtrend...
Combining with Other Indicators
Traders often combine the Parabolic SAR Strategy with other technical indicators, such as moving averages, to validate signals further. Incorporating multiple signals can enhance the accuracy of trading decisions.
Parabolic SAR Indicator Based Trading Strategies
1. Parabolic SAR Trend Following Strategy:
- Use Parabolic SAR dots below the price to indicate an uptrend and above the price to indicate a downtrend.
- Enter trades in the direction of the trend indicated by the Parabolic SAR.
- Consider exiting or reversing trades if the Parabolic SAR dots flip direction.
2. Parabolic SAR Reversal Strategy:
- Watch for a series of Parabolic SAR dots on one side of the price, indicating a strong trend.
- Consider entering trades when the Parabolic SAR dots switch sides, signaling a potential reversal.
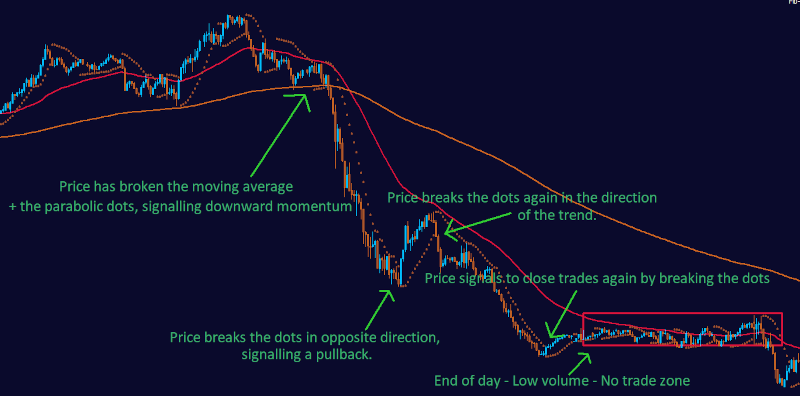
3. Parabolic SAR and Moving Averages Strategy:
- Combine the Parabolic SAR with moving averages to confirm trend direction.
- Enter trades when the Parabolic SAR dots align with the moving average's direction.
4. Parabolic SAR and RSI Strategy:
- Use Parabolic SAR to determine trend direction and combine it with the Relative Strength Index (RSI) for overbought/oversold conditions.
- Consider entering trades when the Parabolic SAR aligns with an RSI signal.
5. Parabolic SAR and Support/Resistance Strategy:
- Use Parabolic SAR to identify potential support or resistance levels.
- Enter trades when the price approaches a Parabolic SAR dot and bounces off it.
6. Parabolic SAR Trailing Stop Strategy:
- Use the Parabolic SAR dots as trailing stop levels.
- Adjust the stop-loss level to the nearest Parabolic SAR dot as the trade moves in your favor.
7. Parabolic SAR Breakout Strategy:
- Wait for the Parabolic SAR dots to flip direction, indicating a potential breakout.
- Enter trades in the direction of the breakout for potential trend continuation.
8. Parabolic SAR and MACD Strategy:
- Combine the Parabolic SAR with the Moving Average Convergence Divergence (MACD) indicator.
- Look for confluence between Parabolic SAR signals and MACD crossovers for trade confirmation.
9. Parabolic SAR and Bollinger Bands Strategy:
- Combine the Parabolic SAR with Bollinger Bands to identify potential volatility-based trading opportunities.
- Look for price bounces or breakouts when the Parabolic SAR aligns with Bollinger Bands.
10. Parabolic SAR and Fibonacci Retracement Strategy:
- Use Parabolic SAR to confirm potential support or resistance levels identified by Fibonacci retracement levels.
- Enter trades when the Parabolic SAR aligns with a key Fibonacci level.
Conclusion
The Parabolic SAR Strategy is a powerful tool for identifying potential trend reversals and trend-following opportunities. By understanding the relationship between the Parabolic SAR dots and the price chart, traders can make more informed decisions related to entry, exit, and trend direction changes.