Relative Strength Index (RSI) Strategy Explained
The Relative Strength Index (RSI) Strategy is a widely used technique in technical analysis, particularly when analyzing the 1-minute chart and other timeframes. This strategy leverages the RSI indicator to identify potential trend reversals and overbought/oversold conditions.
Understanding the RSI Indicator
The RSI is a momentum oscillator that measures the speed and magnitude of price movements. It ranges from 0 to 100 and is typically plotted below the price chart. An RSI value above 70 suggests overbought conditions, while a value below 30 indicates oversold conditions.
How the Strategy Works
The RSI Strategy involves monitoring the RSI indicator for specific levels. When the RSI crosses first below and then back above 30, it can be considered a buy signal, indicating that the asset may be oversold and a potential upward reversal is imminent. Conversely, when the RSI crosses first above and then below 70, it can be viewed as a sell signal, suggesting that the asset may be overbought and a potential downward reversal could occur.
Examples on a Chart
Let's explore how the RSI Strategy can be applied to an actual chart:
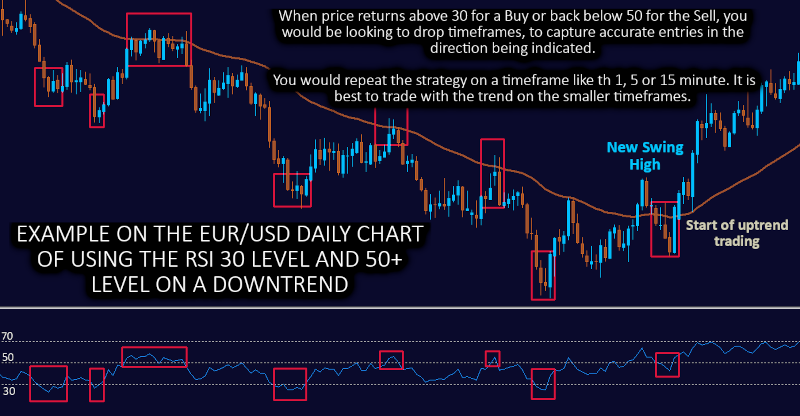

A seen in the first image example, the RSI Strategy can provide accurate signals for short-term traders or long term traders. For instance, if the RSI crosses below the 30 and starts rising back above 30, traders might interpret it as a buy signal, indicating potential upward momentum. If the RSI crosses above 70 and starts declining back below 70, traders might consider it a sell signal, suggesting potential downward momentum, You will also notice that when the trend is strong, the 50 touch and return can also be used as trade entries.
Looking at the second image example, you can see that another strategy was employed. In this scenario, you let the RSI reach considerably far above the 70 or below the 30.
Next you draw a trendline connecting the previous 2 swing highs or lows on the RSI.
Once that trendline is broken you enter the trade, while placing your stoploss at the previous swing high or low in price and your take profit at a 2:1 ratio to your stoploss.
Combining with Other Indicators
Traders often combine the RSI Strategy with other indicators, such as moving averages or trendlines, to validate signals. This approach can help reduce false signals and enhance the accuracy of trading decisions.
RSI Indicator Based Trading Strategies
1. RSI Overbought/Oversold Strategy:
- Identify overbought conditions when RSI crosses above a certain threshold (e.g., 70).
- Identify oversold conditions when RSI crosses below a certain threshold (e.g., 30).
- Consider potential short trades on overbought signals and potential long trades on oversold signals.
2. RSI Divergence Strategy:
- Look for divergence between the price chart and the RSI indicator.
- Bullish divergence occurs when the price makes lower lows while the RSI makes higher lows, suggesting potential upward reversal.
- Bearish divergence occurs when the price makes higher highs while the RSI makes lower highs, indicating potential downward reversal.
3. RSI Trend Reversal Strategy:
- Monitor RSI values for potential trend reversals.
- In an uptrend, watch for RSI to firs rise above and then drop back below 70 as a potential indication of weakening momentum and reversal.
- In a downtrend, watch for RSI to drop below and then rise back above 30 as a potential indication of strength and reversal.
4. RSI and Moving Average Crossover Strategy:
- Combine RSI with moving averages.
- Look for crossovers between RSI and a longer-term moving average (e.g., 200-day MA) for trend confirmation.
5. RSI and Support/Resistance Strategy:
- Use RSI to validate potential support or resistance levels.
- When RSI reaches overbought or oversold levels near key price levels, it may confirm potential reversals.
6. RSI Trend Confirmation Strategy:
- Use RSI to confirm the strength of an existing trend.
- In an uptrend, RSI generally stays above 50, while in a downtrend, RSI stays below 50.
- Look for trades that align with the trend direction indicated by RSI.
7. RSI and Price Patterns Strategy:
- Combine RSI with classic chart patterns (e.g., head and shoulders, triangles).
- Look for RSI divergences or crossovers that align with the formation of chart patterns.
8. RSI Range Trading Strategy:
- Identify a range-bound market by observing RSI oscillations between overbought and oversold levels.
- Look for opportunities to buy near oversold levels and sell near overbought levels within the range.
9. RSI Breakout Strategy:
- Wait for RSI to exit overbought or oversold levels, indicating potential breakout momentum.
- Consider entering trades in the direction of the breakout.
10. RSI and Moving Average Convergence Divergence (MACD) Strategy:
- Combine RSI with the MACD indicator for confirmation.
- Look for signals that align between RSI and MACD to validate potential reversals or trends.
Conclusion
The Relative Strength Index (RSI) Strategy is a valuable tool for identifying potential trend reversals and overbought/ oversold conditions. By understanding the RSI's readings and considering its signals on different timeframes, traders can make more informed trading choices.