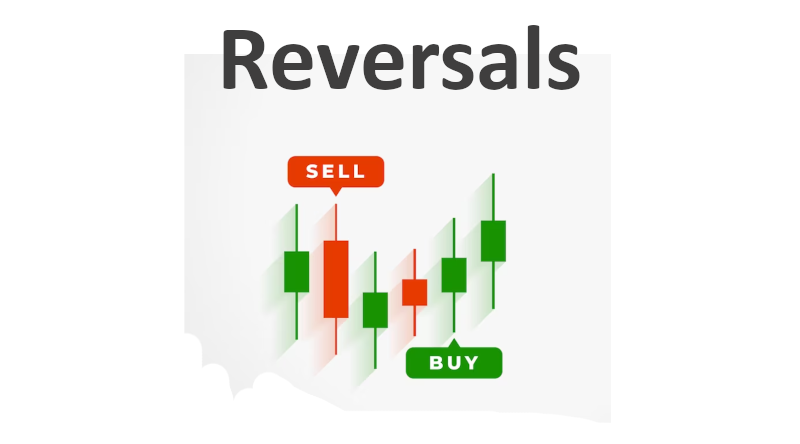
Top Market Structure Reversal Patterns
Within the financial markets, traders often observe recurring patterns that signify potential trend reversals. Recognizing these patterns can be pivotal for trading decisions as they often indicate turning points in the market. Large institutional investors frequently utilize these patterns to anticipate and trade reversals. Here's a deep dive into some of these key patterns:
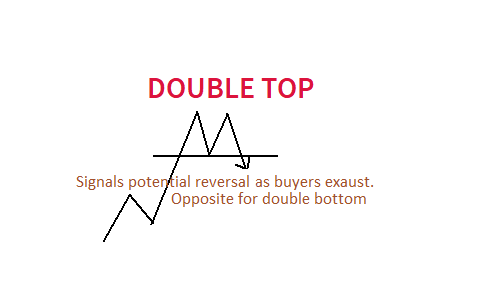
Double Top and Double Bottom:
Double Top: This pattern emerges after a prolonged uptrend and comprises two distinct peaks approximately at the same price level. The double top is a bearish reversal pattern, hinting at the potential transition from an uptrend to a downtrend.Double Bottom: A mirror image of the double top, this pattern forms after a notable downtrend. Consisting of two troughs at roughly identical levels, it's an indication of a potential bullish reversal—signaling a shift from a downtrend to an uptrend.
Head and Shoulders and Inverse Head and Shoulders:
Head and Shoulders: This pattern is characterized by three consecutive peaks. The central peak, termed the 'head,' is elevated compared to the other two, which are called 'shoulders.' Typically observed after an uptrend, this pattern suggests a potential bearish reversal.
Inverse Head and Shoulders: As the name suggests, this is an inverted version of the previous pattern. Found at the end of downtrends, it hints at a forthcoming bullish reversal.

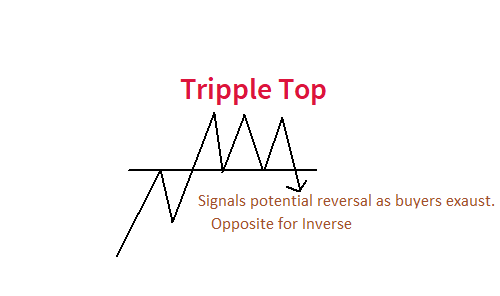
Triple Top and Triple Bottom:
Triple Top: An evolution of the double top, this pattern showcases three successive peaks around the same price level. Emerging after a sustained uptrend, it denotes a possible bearish reversal.
Triple Bottom: The inverse of the triple top, this pattern displays three comparable troughs, flagging a potential bullish reversal after a significant downtrend.
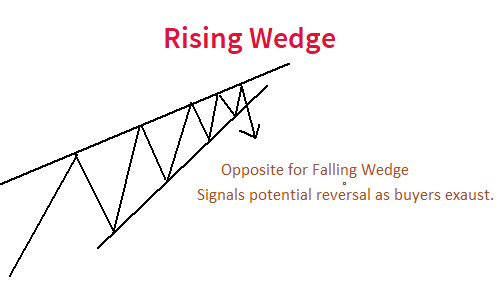
Rising Wedge and Falling Wedge:
Rising Wedge: Formed when both support and resistance trendlines are inclined upwards. As the price action narrows within this converging structure, it often culminates in a bearish breakout, hinting at a possible downtrend.
Falling Wedge: This pattern is the converse of the rising wedge, with both trendlines tilting downwards. It's commonly interpreted as a bullish reversal signal.
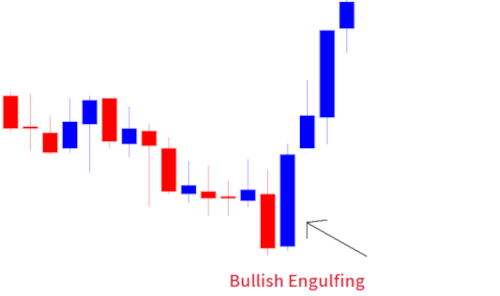
Bullish Engulfing and Bearish Engulfing:
Bullish Engulfing: Identified by a larger bullish candle that completely engulfs the preceding bearish candle. This pattern, typically seen at the end of a downtrend, signals a potential upward reversal.
Bearish Engulfing: Opposite of the bullish engulfing, it's represented by a dominant bearish candle that wraps around the prior bullish candle, suggesting a potential shift from an uptrend to a downtrend.
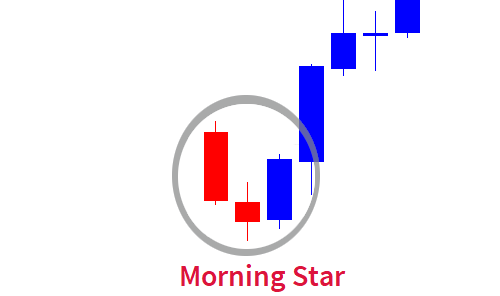
Morning Star and Evening Star:
Morning Star: A bullish reversal pattern formed by a series of three candles. It begins with a long bearish candle, succeeded by a smaller bullish or neutral candle that creates a gap below the first. The sequence culminates in a bullish candle closing above the midpoint of the inaugural candle.
Evening Star: This is the antithesis of the morning star. It starts with a prominent bullish candle, followed by a smaller bearish or neutral candle gapping above the first, and concludes with a bearish candle closing beneath the midpoint of the initial candle.
Hammer and Shooting Star:
Hammer: This candlestick pattern is distinguishable by its small body paired with a prolonged lower wick, reminiscent of a hammer's shape. Found at the tail end of downtrends, it flags potential bullish reversals.
Shooting Star: Bearing a resemblance to the hammer, this pattern showcases a small body coupled with an extended upper wick. It emerges after uptrends, signaling possible bearish reversals.

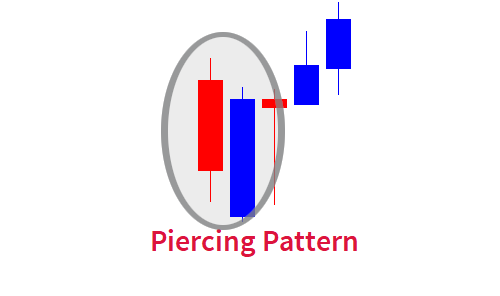
Piercing Pattern and Dark Cloud Cover:
Piercing Pattern: This two-candle pattern initiates with a bearish candle, succeeded by a bullish candle that opens beneath the prior close yet concludes above its midpoint. It suggests a potential bullish reversal.
Dark Cloud Cover: The antithesis of the piercing pattern, it starts with a bullish candle and is followed by a bearish candle. This subsequent candle opens above the preceding close and finishes beneath its midpoint, hinting at a potential bearish reversal.
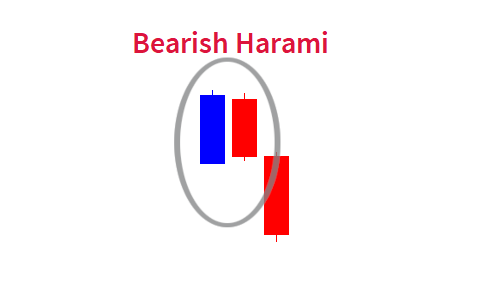
Bullish Harami and Bearish Harami:
Bullish Harami: Constituted of two candles, the pattern unfolds with a bearish candle followed by a comparatively smaller bullish candle. This latter candle remains entirely within the previous candle's range. The pattern indicates a potential shift from a downtrend to an uptrend.
Bearish Harami: Serving as a counterpoint to the bullish harami, this pattern exhibits a bullish candle succeeded by a more diminutive bearish candle that stays within the preceding candle's scope. It signals a possible transition from an uptrend to a downtrend.
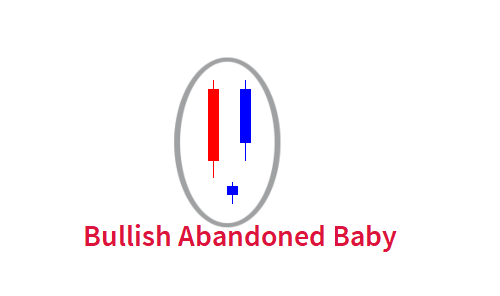
Bullish Abandoned Baby and Bearish Abandoned Baby:
This is a rare reversal pattern that is found at the bottom of a downtrend. It consists of three candles:
- A long bearish (downward or red) candle continuing the downtrend.
- A doji or a small candle with a minimal body that gaps below the close of the previous bearish candle. This candle does not overlap with the prior bearish candle, meaning there's a gap.
- A long bullish (upward or green) candle that gaps above the close of the doji/small body candle and moves into the opposite direction, starting a new uptrend.
The essence of this pattern is that the market gaps twice, first continuing the downtrend, but then immediately reversing and starting an uptrend.
This is the inverse of the bullish pattern and is found at the top of an uptrend. It consists of three candles:
- A long bullish (upward or green) candle continuing the uptrend.
- A doji or a small candle with a minimal body that gaps above the close of the previous bullish candle. This candle does not overlap with the prior bullish candle.
- A long bearish (downward or red) candle that gaps below the close of the doji/small body candle and proceeds in the downward direction, signaling the start of a new downtrend.
In both patterns, the "abandoned baby" refers to the isolated doji/small candle. The gaps on either side of this candle emphasize a sudden and strong reversal in market sentiment.
Remember, while these patterns can provide strong signals, it's essential to use them in conjunction with other indicators and patterns to increase the odds of successful trading.