Understanding Divergence in Trading
Divergence is a powerful concept in technical analysis that often signals potential market reversals. It occurs when the price action of an asset and a technical indicator, such as the Relative Strength Index (RSI) or the Moving Average Convergence Divergence (MACD), move in opposite directions.
In this article, we'll delve deep into the concept of divergence, its different types, and how traders can harness its potential to spot trading opportunities.
What is Divergence?
Divergence refers to the discrepancy between the movement of the price of an asset and the movement of a technical indicator or oscillator. When the two diverge or move away from each other, it can be a sign that the current trend might be weakening or reversing.
Types of Divergence
There are primarily two types of divergences: regular and hidden. Both types can be either bullish or bearish.
- Regular Divergence
- Regular Bullish Divergence: When the price forms lower lows, but the indicator forms higher lows. This type of divergence often suggests that the bearish trend is losing steam, and a bullish reversal might be on the horizon.
- Example: Consider a scenario where the price chart shows a stock reaching new lows, but the RSI starts forming higher lows. This indicates decreasing downward momentum and might signal an impending upward trend.
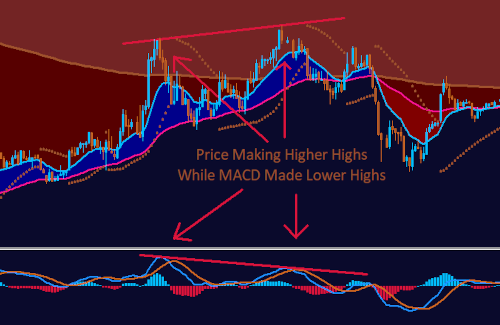
- Regular Bearish Divergence: When the price forms higher highs, but the indicator forms lower highs. This typically implies that the bullish trend may be nearing its end, hinting at a potential bearish reversal.
- Example: Imagine a situation where a currency pair on a chart is making new highs, but the MACD fails to reach new highs and starts declining. This suggests weakening upward momentum and might herald a downturn.
- Hidden Divergence
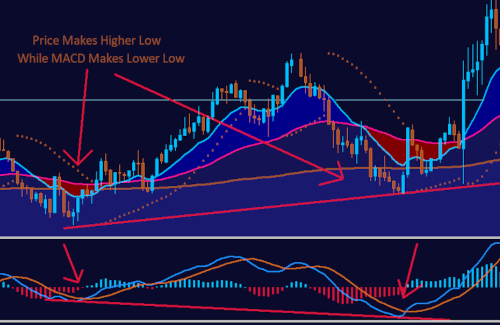
- Hidden Bullish Divergence: When the price forms higher lows, but the indicator forms lower lows. This suggests that the underlying bullish trend is still strong, and the price is likely to continue its upward movement.
- Example: On a chart, if a commodity price forms a higher low during a pullback in an uptrend, but its stochastic oscillator shows a lower low, it might signal a continuation of the upward trend.
- Hidden Bearish Divergence: When the price forms lower highs, but the indicator forms higher highs. This indicates that the prevailing bearish trend remains robust, and the price may continue to drop.
- Example: If a forex pair's price makes a lower high during a bounce in a downtrend, but its oscillator forms a higher high, it could signify a continuation of the bearish trend.
Using Divergence in Trading
Divergences can serve as powerful tools for traders, helping them anticipate potential market reversals or trend continuations. Here are some ways traders can utilize divergence:
- Spotting Potential Reversals: As mentioned, regular divergences often hint at potential trend reversals. When noticed in overbought or oversold conditions, these can be particularly effective.
- Identifying Trend Strength: Hidden divergences can provide insights into the strength of the current trend. If hidden divergence appears during a pullback or bounce, it might indicate that the trend is set to continue.
- Combining with Other Indicators: Divergence becomes more potent when used alongside other technical indicators. For example, a bullish divergence accompanied by a breakout from a trendline or resistance level can reinforce the reversal signal.
- Setting Stop Losses: Recognizing divergences can also assist traders in placing more informed stop-loss orders. For instance, after spotting a bullish regular divergence, a trader might place a stop loss just below the recent low.
Conclusion
Divergence, in its essence, signals a disagreement between price and momentum. Recognizing these discrepancies can offer traders valuable insights into potential trend reversals or continuations. While divergence is a powerful tool, it's crucial to use it in conjunction with other indicators and to always practice sound risk management.