
Day Trading Course for Beginners
Day Trading Lesson 5: Introduction to Indicators and Oscillators
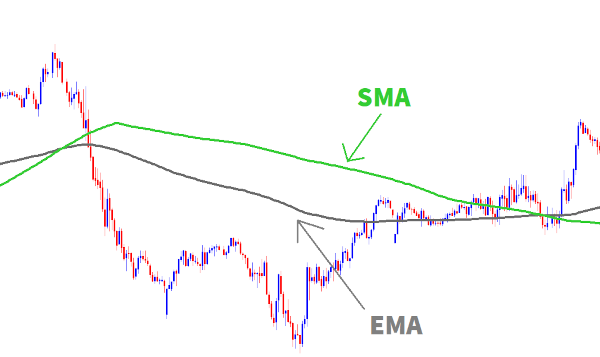
Moving Averages (SMA, EMA)
Moving averages are widely used trend-following indicators. The Simple Moving Average (SMA) calculates the average price over a specific period, while the Exponential Moving Average (EMA) gives more weight to recent prices, reacting faster to price changes. The exponentional moving average is probably the most popular moving average type because of its ability to react faster to large price movements.
When price is above a moving average it is uptrending in comparision to that period of time and considered downtrending when below the moving average.
In the example below, you can see the difference produced by the 2 moving averages. The EMA reacting faster to price changes is fairly apparent.
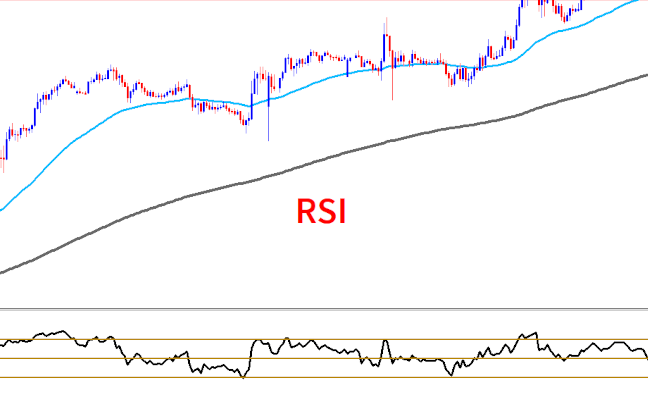
Relative Strength Index (RSI)
The RSI is a momentum oscillator that measures the speed and change of price movements. It ranges from 0 to 100, indicating overbought conditions above 70 and oversold conditions below 30. Traders use RSI to identify potential trend reversals.
Sometimes the opposite is true than the standard "overbought at 70" and "oversold at 30" indications... Like at the end of trend, price will blow right through the 30 or 70 and hold above or below it as it starts a new trend, so you will have to get used to the tell tale signs of this happening. Watching out for new swing highs or swing lows in opposition to the trend, will help you dicipher these instances better, but this will be brought up again later on.
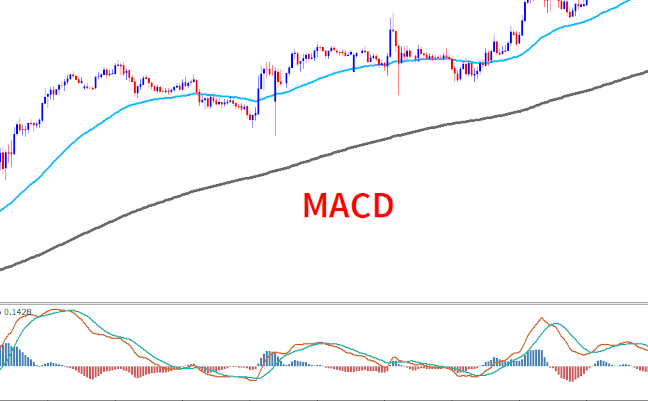
Moving Average Convergence Divergence (MACD)
The MACD is a versatile indicator that consists of a MACD line and a signal line. Crossovers and divergences between these lines provide signals for potential trend changes. Positive crossovers indicate bullish momentum, while negative crossovers suggest bearish momentum.
When the MACD is above zero, it is a very strong indication of upward momentum.
Another important point is that when price has made a signifigant move in one trending direction it will "retrace" in the opposite. On the MACD, this retracement often brings the indicator main lines value back to near zero, before price reverses and heads back in the trends main direction again.
If you observe the example below, you will see in this uptrend that price retraces and the MACD's calculations bring it all the way to zero on 2 occasions where price then returns to the main trend direction. This indication alone, makes for a very powerful trading signal.
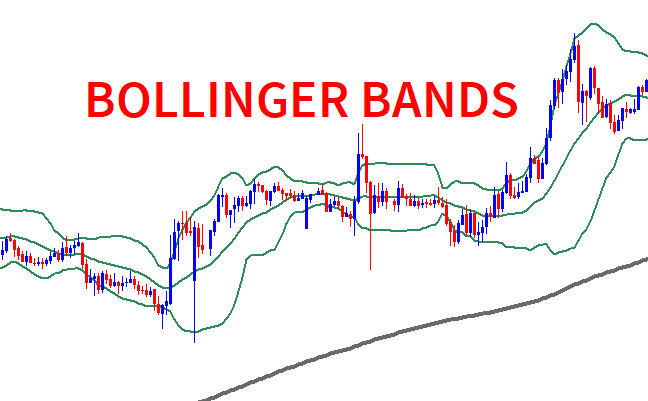
Bollinger Bands and Other Key Indicators
Bollinger Bands consist of a central moving average and upper/lower bands that measure price volatility. Traders use Bollinger Bands to identify potential price breakouts and reversals. Other key indicators include the Average Directional Index (ADX) and the Stochastic Oscillator.
Practical Exercises
Practice plotting moving averages on price charts, interpreting RSI readings, identifying MACD crossovers, and analyzing Bollinger Bands patterns. Familiarizing yourself with these indicators will enhance your ability to make informed trading decisions.
Next up: Day Trading Lesson 6: Chart Patterns and Price Action