
Day Trading Course for Beginners
Day Trading Lesson 6: Chart Patterns and Price Action
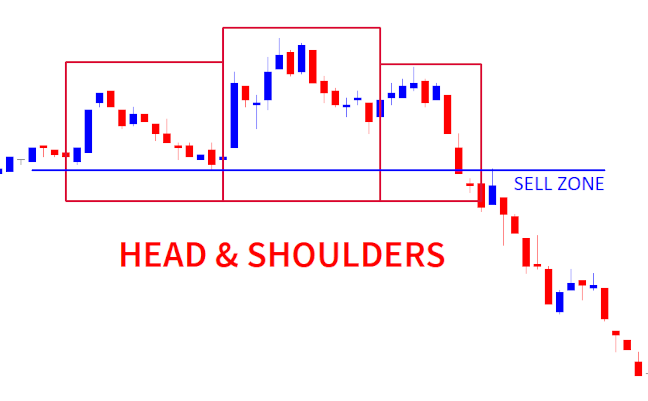
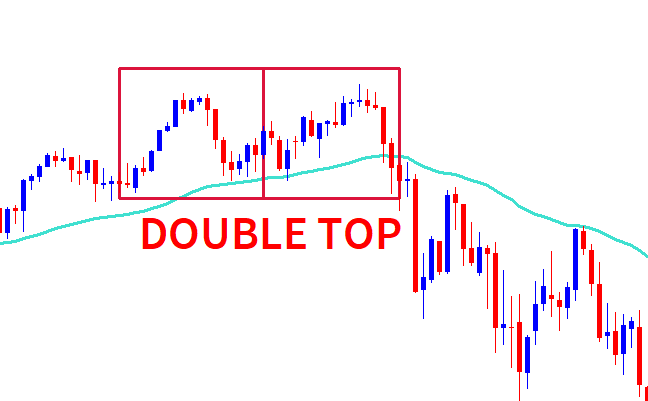
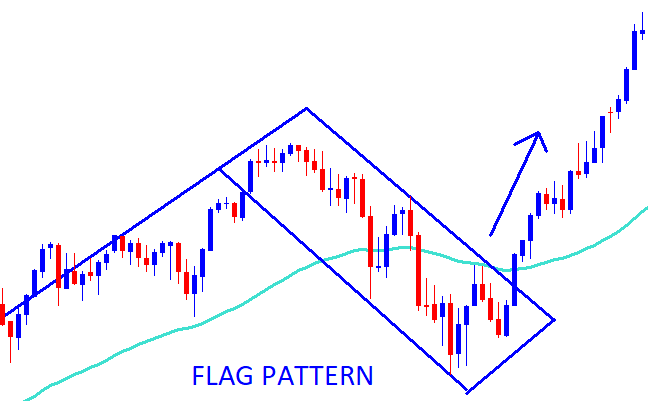
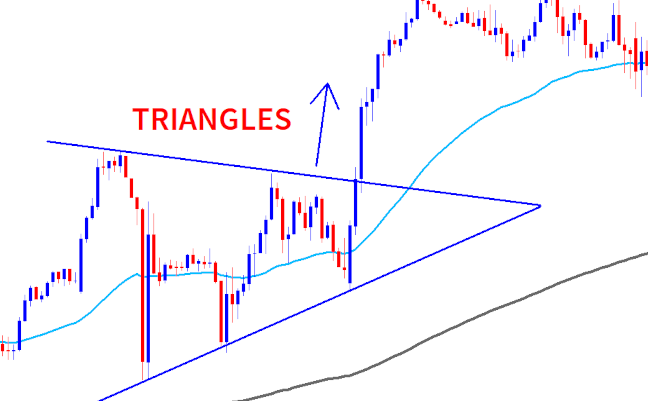
Identifying Chart Patterns
Chart patterns are visual representations of price movements that day traders use to forecast future price directions. Common chart patterns include head and shoulders, double tops and bottoms(Opposite of double top), triangles, and flags.
Our Ultimate Fibonacci EA, has pattern recognition built right into it, so that you can recieve instant notifications to your cell phone when a head and shoulders/inverse head and shoulders pattern, double top/bottom or a new swing high/low against the current trend happens.
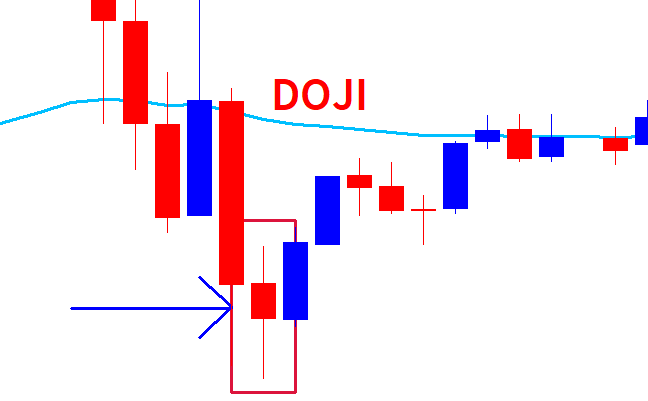
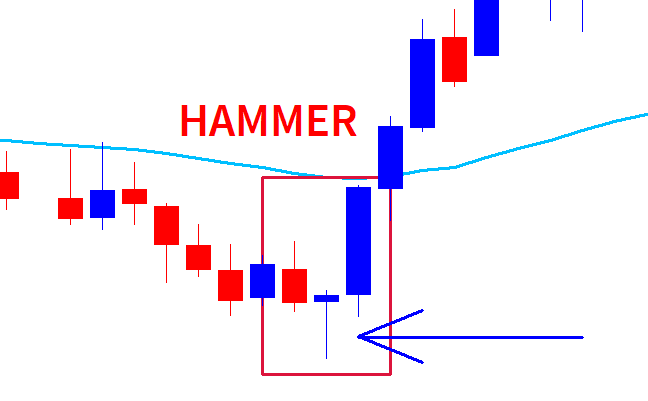
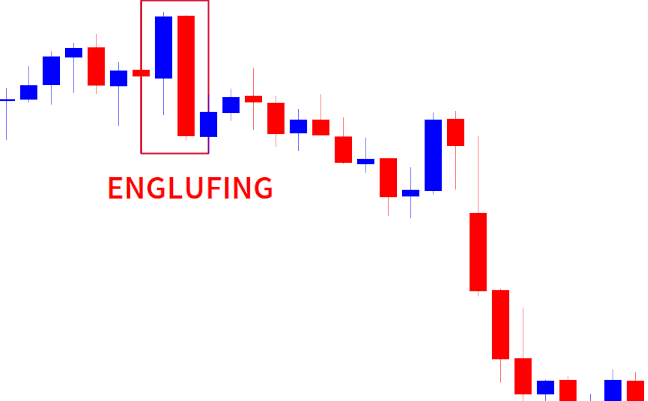
Japanese Candlestick Patterns
Japanese candlestick patterns provide insights into price behavior. Patterns like doji, hammer, and engulfing
patterns can signal potential trend reversals or continuation.
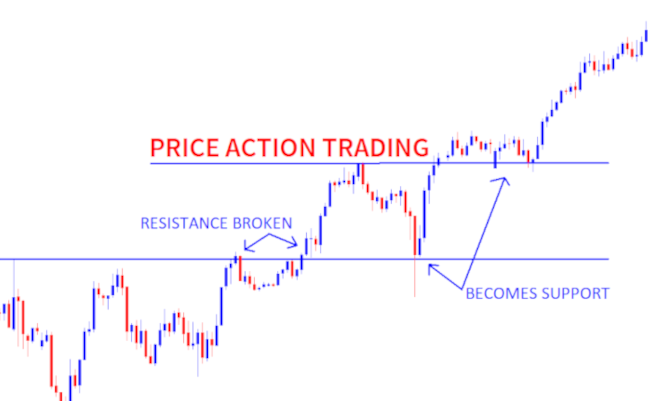
Using Price Action for Trade Confirmation
Price action involves analyzing raw price movements without relying on indicators. Traders look for key support
and resistance levels, candlestick patterns, and chart formations to confirm their trading decisions.
Practical Exercises
Practice identifying various chart patterns on historical price charts, recognizing candlestick patterns, and using price action analysis to confirm your trading setups. Mastering chart patterns and price action analysis enhances your ability to spot potential trading opportunities.
Next up: Day Trading Lesson 7: Advanced Technical Analysis