
Day Trading Course for Beginners
Day Trading Lesson 7: Advanced Technical Analysis
Fibonacci Retracements and Extensions
Fibonacci retracements and extensions are popular tools that traders use to identify potential support and resistance levels on the price charts.  These levels are based on the Fibonacci sequence, a series of numbers in which each number is the sum of the two preceding ones, usually starting with 0 and 1(0,1,1,2,3,5,8,13,21,34,55,89,144,233,377,610,987).
For example, 610 is the sum of 233+377=610 and 610 now adds 377 to equal 987... and so on.
Fibonacci Retracements: In trading, Fibonacci retracements are used to identify potential reversal levels in the market. These levels are calculated by taking two extreme points (usually a peak and a trough) on a chart and dividing the vertical distance by the key Fibonacci ratios of 23.6%, 38.2%, 61.8%, 78.6% and 100%. (Some traders include the 50% line, but it is not actually a fibonacci number.
Many novice traders avoid learning fibonacci retracements at first because it seems intimidating, however it is extremely simple and is also one of the most powerful tools for a trader to understand.
When a trader masters fibonacci retracements they will know where large price moves will happen and will know where small trends will end because they are running into important fibonacci zones in the other direction.
Fibonacci Extensions: On the other hand, Fibonacci extensions are used to project potential levels of support or resistance in the direction of the current trend. These levels are calculated by taking a trend move (from a low point to a high point or vice versa), and then adding multiples of the key Fibonacci ratios (61.8%, 100%, 138.2%, and 161.8%) to the chosen point in the trend.
Both Fibonacci retracements, expansions and extensions are drawn on the price chart to highlight areas of potential trend reversals or continuation.
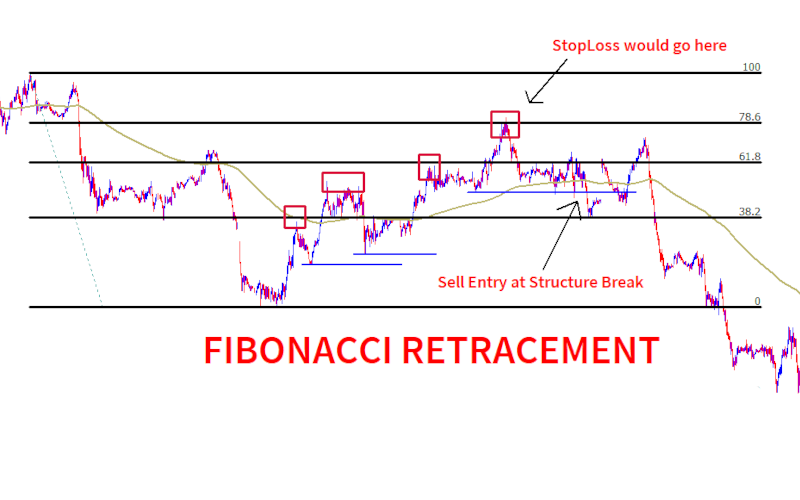
Example of the Fibonacci Retracement tool in action.
The red squares are new "mini swing highs" during the retracement process. The straight blue lines are the "mini swing lows", that resulted in new swing highs (These are very important, as their breaking signals a change in direction). Once the most recent "mini swing low"(That made a new "mini swing high") is broken we have a break in structure and a signal to look for a selling opportunity(Either at that break or the next pullback). It is also important to note that this break should come after the price had at least touched the 38.2 retracement level and preferably the 61.8.
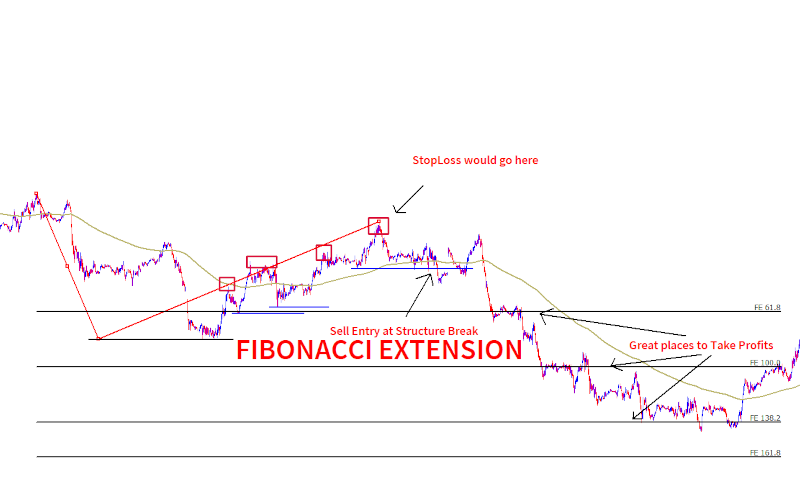
Example of the Fibonacci Expansion tool in action.
The Fibonacci expansion tool is used by connecting 3 spots. For an uptrend, the recent low, the recent new high and the retracement point.
The resulting levels of 61.8, 100, 138.2 and 168.2 are all ideal take profit points.
For safe approach, use the closest to second closest levels as your take take profit zones.
You could also consider closing portions of your trade at each point, along with a trailing stop to capture what profits are available, if price did turn around.
Find these tools in your MT4 Terminal, by clicking "Insert-->Fibonacci"
In the next image, we are using the same chart as previously, for the Fibonacci Retracement Tool, but now using the expansion tool to set some take profit targets.
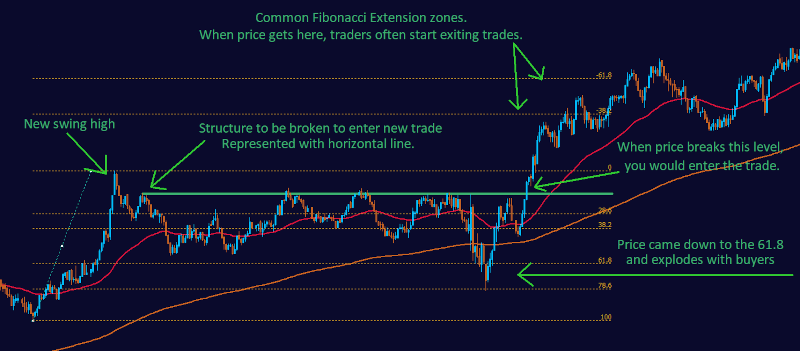
Example of the Fibonacci Extension tool in action.
The Fibonacci extension tool(Which is our preferred tool because it is part of the fibonacci retracement tool) uses the Fibonacci Retracement tool to plot potential take profit levels. These levels are simply the inverse of levels like the 61.8 or 38.2.
This means that the distance from the swing low or swing high to the 61.8 retracement level would go in the opposite direction an equal distance.
These are great TakeProfit levels, especially in strong trending markets.
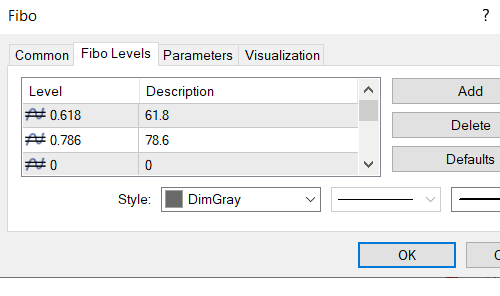
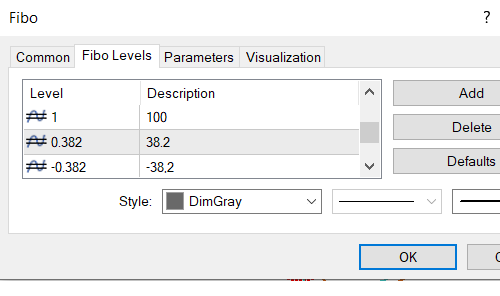
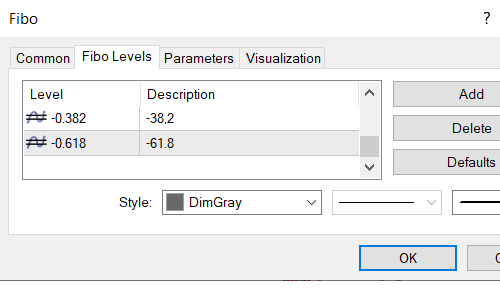
In the next images, you can see how this works and how you would input it into your fibonacci retracement tool.
In the example below you have a very safe entry, but with more experience, you would likely enter even closer to the .618 bounce.
Here is how you would input the Fibonacci Extensions into your MT4 Fib Retracement Tool.
Our Our Ultimate Fibonacci EA, allows you to set predetermined "fib zones", where you the EA will trigger and then start looking for an entry. Once in the zone, the EA sets a flag and waits for an automated entry to trigger, to send a text signal to your phone OR to deactivate that fib tool if certain conditions prove that the trade no longer a good trade opportunity..
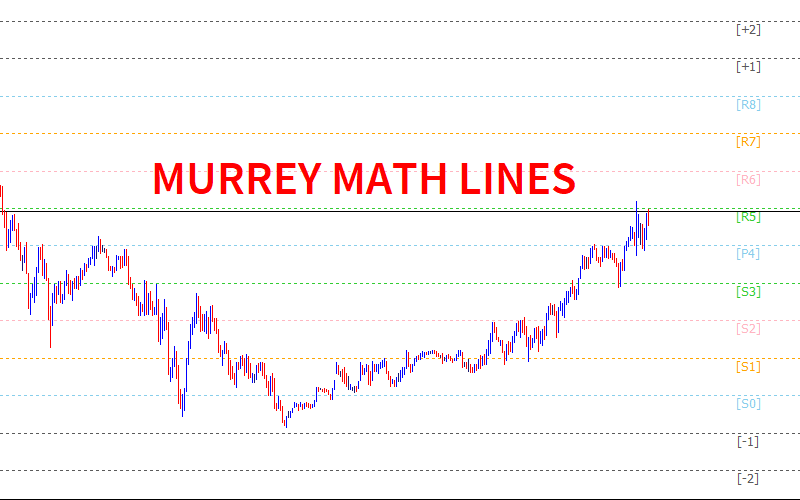
Pivot Points and Support/Resistance Zones
Pivot points are calculated levels that can act as support or resistance. Day traders and all types of traders use pivot points along with support/resistance zones to make trading decisions. Pivot points are especially popular in intraday trading.
A common indicator for pivot points is the Math Murrrey Lines indicator. Download this indicator for free here:
Save these files into the indicators folder of your MT4(In MT4 CLICK "File->Open Data Folder->MQL4->INDICATORS"). Next, restart your MT4.
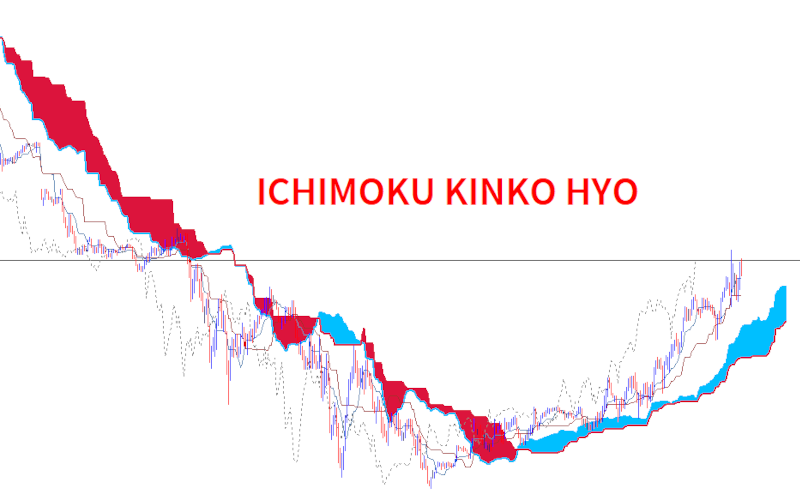
Ichimoku Cloud Indicator
The Ichimoku Cloud is a comprehensive indicator that provides insights into support/resistance levels, trend direction, and momentum. It consists of several components, including the cloud, Tenkan-sen, Kijun-sen, and more.
Find this indicator in your MT4 Terminal, by clicking "Insert-->Indicators->Trend"
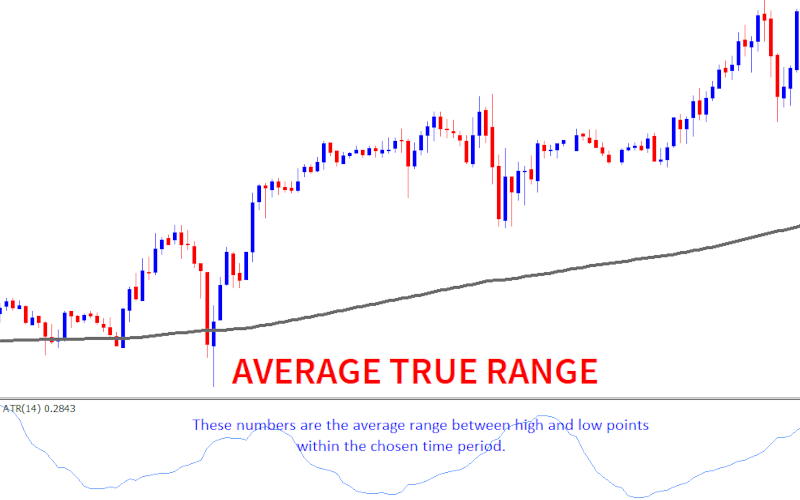
Average True Range (ATR) and Volatility-Based Strategies
The Average True Range (ATR) indicator measures market volatility. Traders use ATR to adjust position sizes and set stop-loss and take-profit levels based on current market conditions. Volatility-based strategies help traders adapt to changing market dynamics.
Find this indicator in your MT4 Terminal, by clicking "Insert-->Indicators->Oscillators"
Practical Exercises
Practice drawing Fibonacci retracement and extension levels, using pivot points, and using the Ichimoku Cloud indicator to analyze price charts. Becoming proficient in advanced technical analysis tools enhances your ability to make accurate trading decisions.
NOTE: There are many indicators and tools and every trader is different, so you need to try out different ones to feel out what indicators you understand and enjoy using the most.
Next up: Day Trading Lesson 8: Developing Trading Strategies