Fibonacci Retracement Strategy Explained
The Fibonacci Retracement Strategy is a popular technical analysis method used to identify potential support and resistance levels, as well as price corrections, in the financial markets. This strategy leverages the Fibonacci retracement levels, which are based on the Fibonacci sequence, to determine potential entry and exit points.
Understanding Fibonacci Retracement Levels
Fibonacci retracement levels are horizontal lines that indicate potential price reversal or correction zones based on the Fibonacci sequence ratios. The key levels include 23.6%, 38.2%, 61.8%, and 78.6%. These levels are drawn between significant price highs and lows on a chart, providing potential support and resistance areas.
In most cases the 61.8 to 78.6 zone is a favourite retracement zone of traders, while the 38.2 tends to work the best in a very strong trending markets.
The 38.2 will almost always generate a lot of orders but often it will not be enough to make a new high or low, so be aware that 38.2 can occasionally come with pushes to the previous high or low but then have a retreat back down to the 61.8 area, for the real push.
Fibonacci Sequence:
The Fibonacci sequence is a series of numbers where each number is the sum of the two preceding ones, usually starting with 0 and 1.
0, 1, 1, 2, 3, 5, 8, 13, 21, 34, 55, 89, 144, 233 and so on...
Ratio Calculation:
- 61.8% (Golden Ratio): If you take any number in the sequence and divide it by the number that immediately follows it, the ratio tends to be about 0.618. For example:
- 34/55 ≈ 0.618
- This is known as the "Golden Ratio."
- 38.2%: This is derived by dividing a number in the sequence by the number two places to the right:
- 21/55 ≈ 0.382
- Alternatively, it can also be viewed as the complement of the 61.8% ratio: 1 - 0.618 = 0.382.
- 23.6%: This comes from dividing a number in the sequence by the number three places to its right:
- 13/55 ≈ 0.236
- 78.6%: This isn't directly derived from the Fibonacci sequence in the same manner as the others. However, it's the square root of 0.618 (.786). It's not a "pure" Fibonacci ratio, but traders have found it to be a very effective retracement level in charts.
Application in Trading:
Traders use these Fibonacci retracement levels to identify potential support and resistance levels in the markets. The idea is that after a significant price movement (either up or down), prices will often "retrace" or "pull back" a portion of the original movement before continuing in the original direction. The Fibonacci levels are potential areas where traders might expect the price to change direction.
It's essential to note that while many traders use Fibonacci retracement levels in conjunction with other forms of analysis to make trading decisions, no single tool or indicator is foolproof, and they should be used as part of a broader trading strategy.
How the Strategy Works
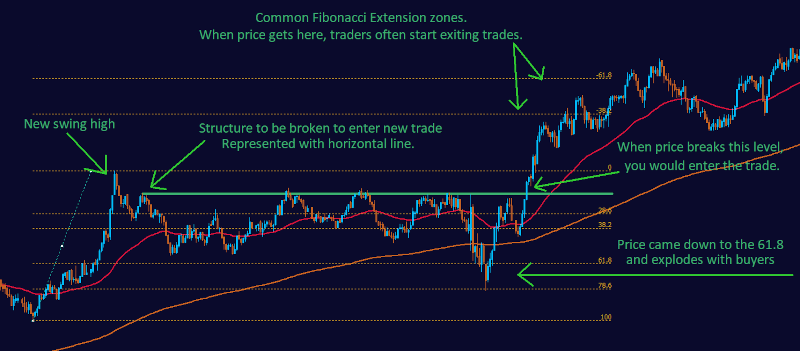
The Fibonacci Retracement Strategy involves identifying a significant price movement (A new Swing High OR new Swing Low), and then applying the Fibonacci retracement levels to that movements "retracement". Traders look for the market to make a new high or low and then retrace back to these fibonacci zones, before attempting to make another new swing in the same direction:
- 38.2%-50% and 61.8%-78.6%: These levels are often used to identify potential retracement points within a trend. Traders might anticipate price reversals or corrections around these levels.
- 50%: This level is not a true Fibonacci ratio, but it's included due to its psychological significance. Price often exhibits reactions at the 50% level, making it an important support or resistance zone.
- 23.6%: This level can also provide potential continuation signals. While less commonly used, it can still offer insights into market dynamics.
Examples
Let's explore examples of the Fibonacci Retracement Strategy:
Uptrend Reversal:
If an asset is in an uptrend and starts retracing, traders might look for potential buying opportunities near the 38.2%, 50%, or 61.8% or 78.6% retracement levels. These levels could act as support, potentially leading to a continuation of the uptrend.
In the example below, you can see that price responded at the 61.8% zone and pinged perfectly off of the 78.6% retracement level.
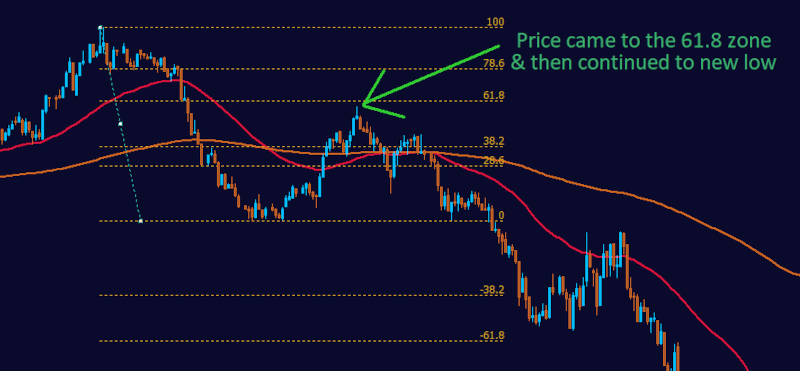
Downtrend Correction:
When an asset is in a downtrend, a price bounce near the 38.2%, or 61.8% retracement levels might signal a potential correction before the downtrend resumes.
Combining with Other Indicators
Traders often combine the Fibonacci Retracement Strategy with other indicators, such as trendlines or moving averages, to confirm potential reversal points. Combining multiple signals can enhance the accuracy of trading decisions.
Fibonacci Indicator Based Trading Strategies
1. Fibonacci Retracement Strategy:
- Identify a recent price swing from low to high (or high to low).
- Apply Fibonacci retracement levels (e.g., 38.2%, 61.8%) to the price swing.
- Look for potential support or resistance at these levels and consider entering trades when the price reacts near them.
2. Fibonacci Extension Strategy:
Part 1:
- Identify a significant price move (up or down) and apply Fibonacci extension levels to project potential price targets.
- Look for potential reversal or continuation points at these extension levels for trade entries or exits.
Part 2:
- Identify areas where multiple Fibonacci levels (retracement and extension) align with other technical tools, such as trendlines, RSI or moving averages.
- These confluence zones can serve as strong support or resistance areas for potential trading opportunities.
Part 3:
- Combine Fibonacci levels with candlestick patterns (e.g., doji, engulfing) to confirm potential reversals.
- Look for confluence between Fibonacci levels and candlestick patterns for trade entries.
Keys to succesful Fibonacci trading:
- It is absolutely essential that price has made a new high, to be looking for Buy setups OR that price has just made a new low, in order to be looking for sell set ups.
- If price was making new lows and then fails to make a new low and instead makes a new high, begin looking for buy setups because the trend is likely over.
- Use higher timeframes to see the big picture. For Example: Before making a decesion to make another sell trade after a recent swing low has happened, check 1 or 2 timeframes higher to see if you are about to run into a 61.8, in the opposite direction.
- What this means is that on a large scale, price may be in a large uptrend, but its downward retracement may last for hours or days even, so on a smaller timeframe it will appear to be downtrending.
- You need to pay attention to where that downtrend is going to run into the 38.2 or 61.8 on a large scale because that zone will likely turn your downtrend back into an uptrend or will at least cause a large spike to happen against your current small scale trend.
- The higher the timeframe, the stronger the trend. A 61.8 on the 1 minute chart is like a BB gun compared to a Nuclear Bomb from the daily chart. Always give respect to the higher timeframes. When trading against the direction of the large scale trends, use the their key zones like 38.2 and 61.8 as your target zones for where your small scale trend will likely end.
- It is generally much safer to prefer trades that reach all the way to the 61.8%-78.6% levels, as 38.2% is often, not a far enough retracement to initiate enough volume of buyers or sellers to move price with a lot of force.
- The exception to this can be at the very early stages of a new trend that has reacted to a fib level from a higher timeframe.
- The fibonacci sequence at its core is all about the same patterns repeating themselves over and over on every scale from the smallest to the largest scale. It happens all throughout nature and is not just some trading idea.
- The interesting thing is that this scale idea is extremely noticable in trading. All the way from the 1 minute chart to the weekly chart, it's all the same pattern. New swing highs and new swing lows, pull backs to fib zones and so on. Once you see it you can't unsee it. It can take some time to fully understand, but its worth it.
- Another tip is that when price breaks through you fibonacci zones, before you think the entire trend has reversed, look out a little farther to see if there is still a larger part of that swing that you can redraw your fibs on in the same direction.
- Trends often have 3-5 pulses and then need a "breather". This is when they pullback/retrace on a larger scale, turning those 3-5 swing pulses into one large swing on a larger scale. (This may seem confusing now, but in time it will make sense)
Conclusion
The Fibonacci Retracement Strategy is a valuable tool for identifying potential support and resistance levels and price corrections. By understanding the Fibonacci retracement levels and considering additional indicators, traders can refine their trading strategy and make more informed decisions related to entry, exit, and risk management.
If you're intertested in Fibonacci trading, please consider our EA, The Ultimate Fibonacci Ea. You can draw your fibs and let the EA enter trades based on confirmation entries.
It will also manage your trades for you with break-evens, trailing stops and inProfit Exits. Check it out here: The Ultimate Fibonacci EA